Tagged: complexity
How Complex Systems Fail
Complacency and the Clear/Chaotic boundary
We live in A Complex World. We are surrounded by complex systems. In this post I will take a moment to highlight how complex systems fail.
My colleague Jason Koppe shared a great summary in a tweet anticipating this post, linking to Richard Cook’s how.complexsystems.fail.
The website above is a great reference and goes into a lot… A LOT… more detail than I will go into here. I want to focus on a particular aspect of how complex systems fail that I find particularly useful in the context of Onboarding to a Software Team.
Clear/Chaotic Boundary
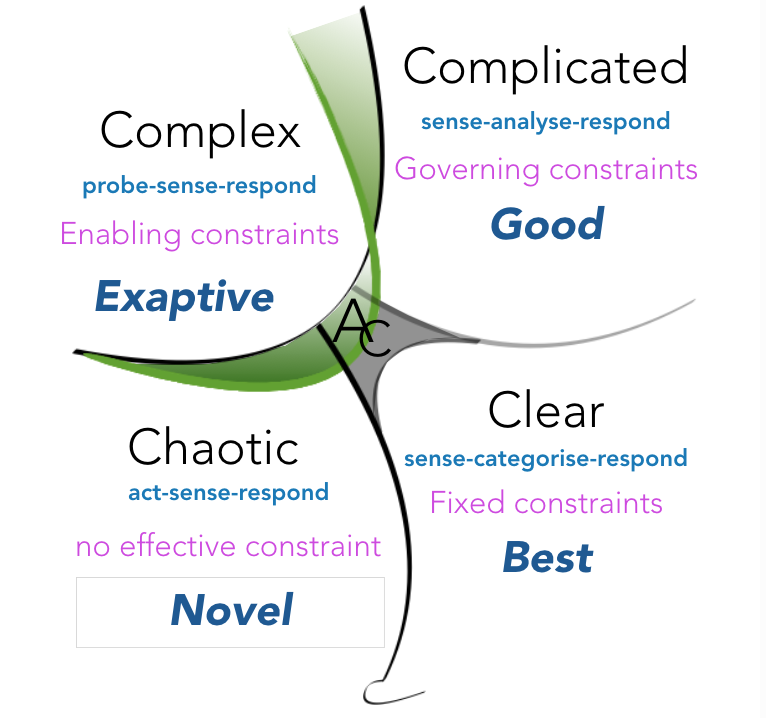
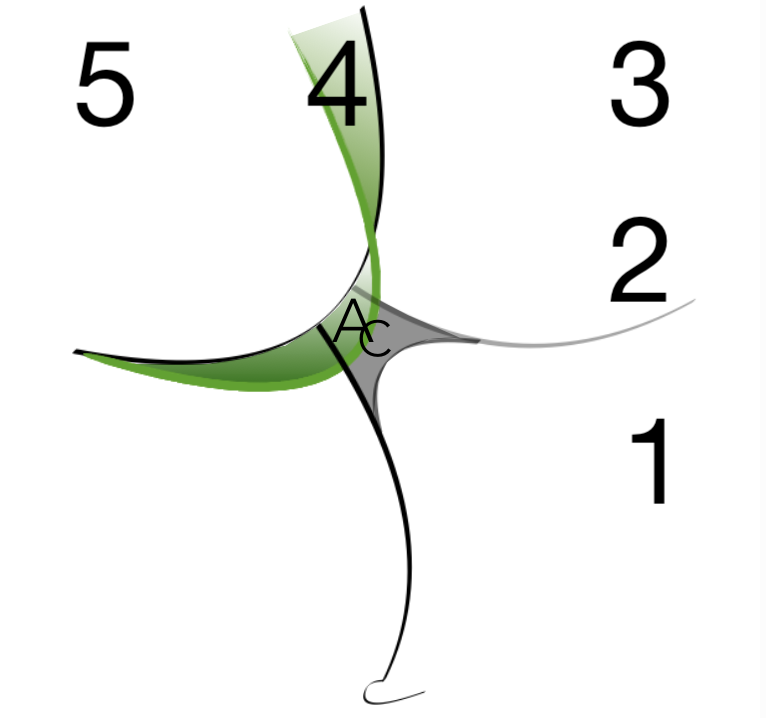
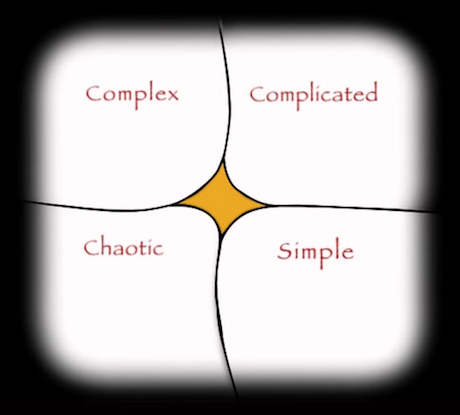
I highlighted various aspects of the Cynefin framework in this series so far. I want to return to it once again and discuss the boundary between the Clear and Chaotic domains. Notice, in the figure below, that the boundary is drawn with a squiggle on the bottom. This is intentional, in that it intends to be a visual representation of a cliff between Clear and Chaotic. Transition from Clear to Chaotic is a one way transition without a direct return path. Why would Clear become Chaotic?
In the framing of Economy of Thought, I pointed out that while the world is complex, it is expensive to treat everything as such and I can choose to summarize some of the complexity as Clear.
It ain’t what you don’t know that gets you into trouble. It’s what you know for sure that just ain’t so.
Mark Twain … maybe.
The problem occurs when I treat something as Clear and it turns out not to be the case.
Rasmussen’s Model
So, what happens that shifts a Clear system into the Chaotic domain? It’s not like it’s waiting for me to turn around and then beelines straight for the cliff into Chaos screaming “YOLOOOOOO!…” on the way down.

Jens Rasmussen came up with a model that I think captures the intuition behind what is happening.
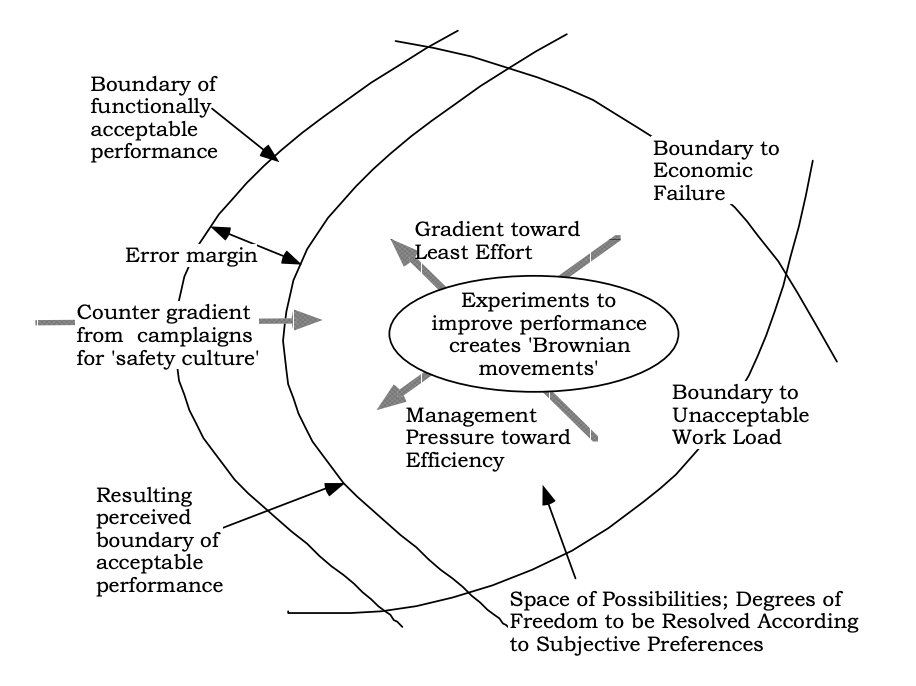
This is a busy figure. Take note of the boundaries on the right hand side. There is a Boundary to Economic Failure; if the system moves beyond there, you go bankrupt. There is a Boundary to Unacceptable Work Load; if the system moves beyond there, everyone is spents and work stops. As a result of these boundaries, there exists a pressure “from management” toward efficiency which applies a force to the left, away from the Boundary to Economic Failure. Additionally, there is a gradient towards ease of work, which applies a force to the left, away from the Boundary to Unacceptable Work Load. Together, these forces create a movement in the system toward the third boundary on the left-hand side, the Boundary of functionally acceptable performance, i.e. failure.
So, it seems rather straightforward, we should simply not let the system drift beyond the failure boundary. Well, there are a few constraints that make this difficult.
Normalization of Deviance1
While Rasmussen’s model is valuable, here is a depiction of what it looks like for complex systems in practice.
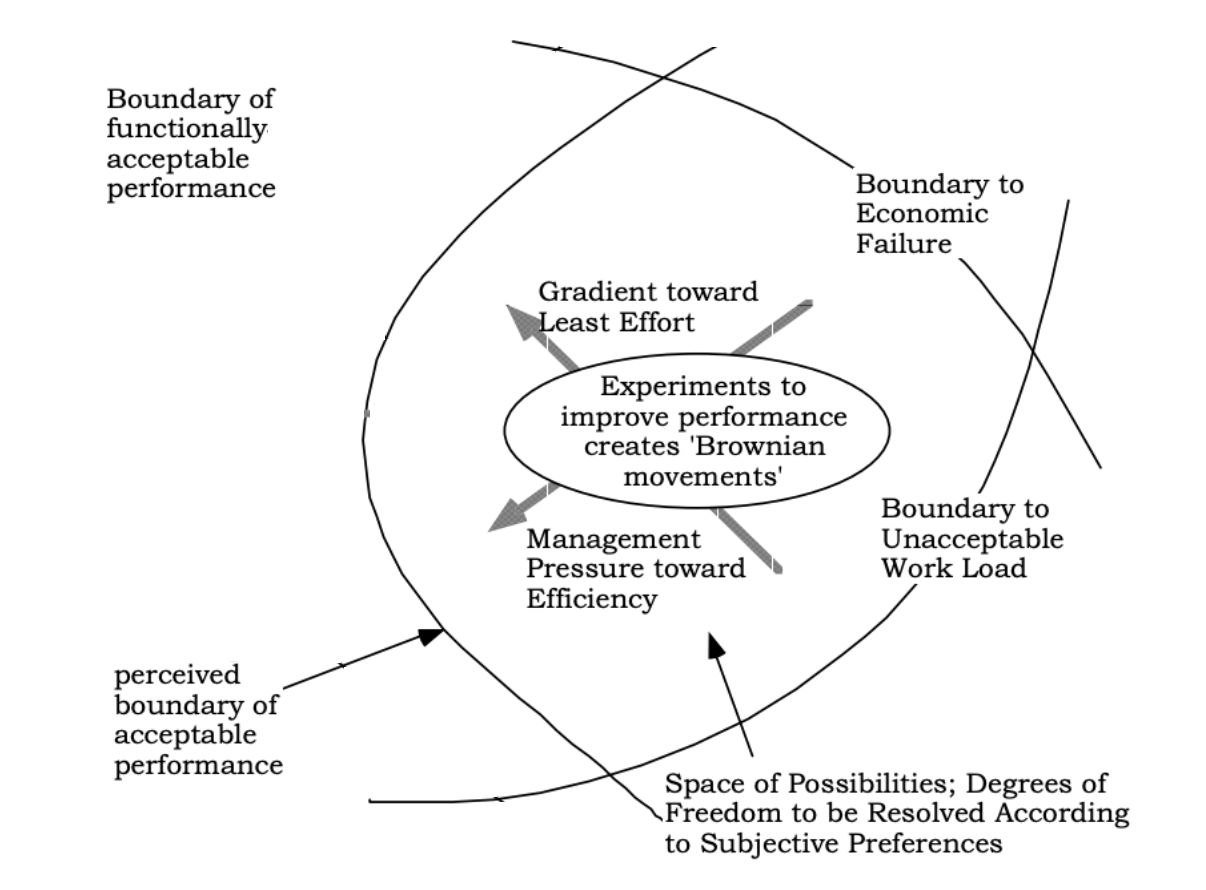
Note the loss of information on the left hand side. We still know that the Boundary of functionally acceptable performance is somewhere on the left, but we don’t know exactly where it is. All we have is our perceived boundary of acceptable performance. This disparity causes an interesting dynamic. Let’s zoom in on the perceived boundary of acceptable performance and consider what happens to a system near such a boundary.
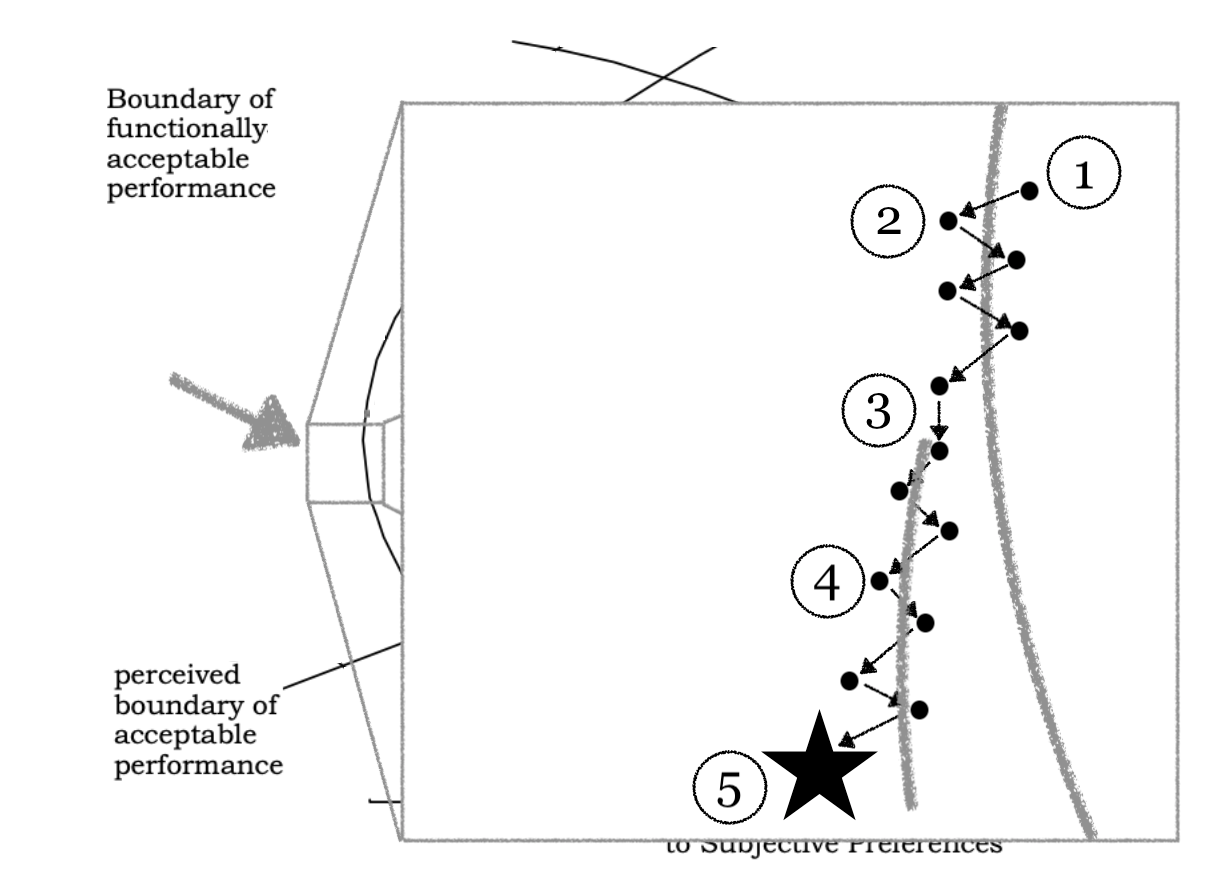
- The system, due to normal operation, crosses our perceived failure boundary.
- We notice that things are in a configuration where we expect them to fail, they’re not failing yet, so we quickly apply remediation and shift the system back to within acceptable performance. This cross into failure, no actual failure, and quick remediation continue until we reach 3.
- We now discovered that our perceived failure boundary is not the actual failure boundary. We acclimatize. We move our perceived failure boundary to match.
- The pattern of crossing into failure, system not failing, and remediation back into acceptable (now shifted) performance continues. We drift further.
- We ultimately locate the actual failure boundary, the system fails, and we inadvertently entered into Chaos.
The fact that the actual failure boundary is often unknown until our complex system fails, combined with the invisible unknown boundary continually shifting (in the Complex domain constraints change due to actions and the environment), demonstrates a pattern of how our systems will continuously flirt with the failure boundary. Do not forget that we have forces pressuring the system from right to left, the pressure of efficiency, and the gradient toward ease of work. This continuous pressure and not really knowing where the failure boundary lies combine to continuously shift the system toward failure.
What Do You Think?
How do you think about system failures? Let me know in the comments.
Next Up
Next, I will discuss how the words we use shape our thinking: Metaphors We Live By.
Cynefin Complexity
The Cynefin Framework

Last time in the onboarding series I wrote about complexity through the frame of relationship between cause and effect in the world. Today, I want to introduce Dave Snowden’s Cynefin framework1 which underpins what I mean by complexity.
Ordered Systems
So far, I defined an Ordered System as a system where a relationship between cause and effect can be determined. The relationship could be clear or discovered through analysis. When the relationship is clear, that is a Clear System.

For a Clear System, the sense-making heuristic is sense-categorize-respond. We sense the situation, we categorize it (because cause and effect are clear), and we respond using the Best practice available for the category we selected. The constraints are Fixed, do not change, and will probably never change on the timescale under consideration (whether we act or not).
When the relationship between cause and effect can be discovered through analysis, that is a Complicated System.

For a Complicated System, the sense-making heuristic is sense-analyze-respond. We sense the situation, we analyze it (because cause and effect can be determined through analysis), and we respond using one of the Good practices available.2 The constraints are Governing constraints, “…[they] provide limits to what can be done. In terms of our policies and processes, these are hard-and-fast rules. They are context-free, which means they apply to everything, regardless of context.”3 Because we enforce the constraints, the constraints do not change (similarly to Fixed constraints), and will probably never change on the timescale under consideration (whether we act or not).
Chaotic Systems
When the relationship between cause and effect cannot be determined, that is a Chaotic System.

For a Chaotic System, the heuristic is to act-sense-respond. We act to establish order, we sense where stability lies, and we respond using Novel methods attempting to turn chaos into complexity.4 There are no constraints. “Chaos is caused by a lack of constraints; meeting constraints will cause it to dissipate. Think of fire burning until it runs out of fuel or oxygen. This is what makes Chaos transient and short-lived; it will rapidly grow until it meets constraints, at which point the situation resolves (but not necessarily in your favour).”5
Complex Systems
When the relationship between cause and effect can only be determined in hindsight, that is a Complex System.

For a Complex System, the heuristic for sense-making is probe-sense-respond. We probe via multiple parallel and independent safe-to-fail experiments. We sense whether our probes are working, and we respond using Exaptive6 practices. If a probe is working, we reinforce it. If a probe is failing, we should dampen it. We should not conduct the probes in the first place unless we’ve identified amplification/reinforcement and dampening strategies ahead of time. The constraints are Enabling in the sense that they constrain what probes we can conduct (as opposed to any probe imaginable if there were no constraints). The constraints will change on the timescale under consideration due to our own actions (probes) and external factors.
A Cheat Sheet
Liz Keogh has a very useful shortcut for estimating complexity to get you started7:
5. Nobody has ever done it before.
4. Someone outside the organization has done it before (probably a competitor)
3. Someone in the company has done it before.
2. Someone in the team has done it before.
1. We all know how to do it.
What Do You Think?
This was quite a lot of dense exposition. If you feel something could use more clarification, let me know in the comments.
Next Up
I’ll continue sharpening the definition of complex through the framing I call the Economy of Thought.
1 https://en.wikipedia.org/wiki/Cynefin_framework. Accessed on 9 Mar 2021.
2 It is worth noting that given you have the appropriate expertise, there are likely multiple good approaches to take. Pick one.
3 Keogh, Liz (2019). “Constraints and Cynefin”. https://lizkeogh.com/2019/12/09/constraints-and-cynefin/. Accessed on 9 Mar 2021.
4 Snowden, David J.; Boone, Mary E. (2007). “A Leader’s Framework for Decision Making”. https://hbr.org/2007/11/a-leaders-framework-for-decision-making. Accessed on 9 Mar 2021.
5 Keogh (2019).
6 Exaptive in the sense that we are using our existing capabilities and exapting them for novel purposes that they were perhaps not originally intended for. Think of using a piece of paper to keep a chair from rocking back and forth.
7 Keogh, Liz (2013). “Estimating Complexity”. https://lizkeogh.com/2013/07/21/estimating-complexity/. Accessed on 10 Mar 2021. Accompanying illustration is based on one of Keogh’s presentations.
Model of Communication for Information Sharing
In How To Do Things, I mentioned that in order to thrive in the world, one of useful things to do is to focus on communication. Here is a model of communication for information sharing.1
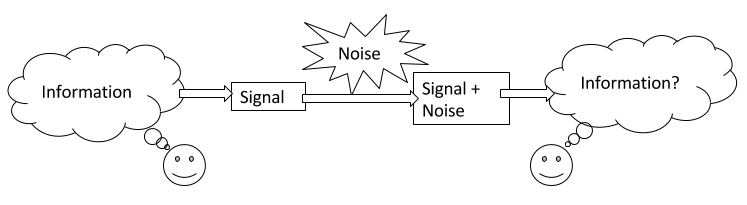
When I speak of focus on communication, I mean that both the information sender and the information receiver have a shared mental model for communication that resembles something like the above. I also expect them to understand that the purpose of communication in this context is to share information. Most importantly, I expect the sender and receiver to understand all the ways in which the communication process can result in failure to transmit the intended information.
In this model, there are three sources of error in communication. The first source of error can occur when information is encoded into a signal, for example, when we translate an idea in our minds into words, the many meanings of the words may or may not correspond to what we mean to communicate. The second source of error can occur when noise alters the signal, for example, having a conversation in a loud room can result in the recipient not hearing a word correctly, or perhaps not hearing a word at all. The third source of error can occur when information is decoded from signal back into information, for example, for words with multiple meanings, the recipient may choose to select a meaning that the sender did not intend.
What is important to notice is that even in the total absence of noise, we still have two sources of error, the sender encoding the information, and the receiver decoding it.
Before we get into how to correct encoding and decoding errors, let’s consider how can we detect errors in communication in the first place.
One effective way of detecting errors is to ask for a confirmation brief from the receiver. In other words, ask someone to repeat back to you what you just told them. Using this method, the recipient encodes the information received into a signal, the signal (plus noise) reaches the original sender, who then decodes the signal into information. The original sender then compares the original intended information with what they decoded from the confirmation brief and can decide whether or not the information is close enough to what they intended or whether further clarification is needed.
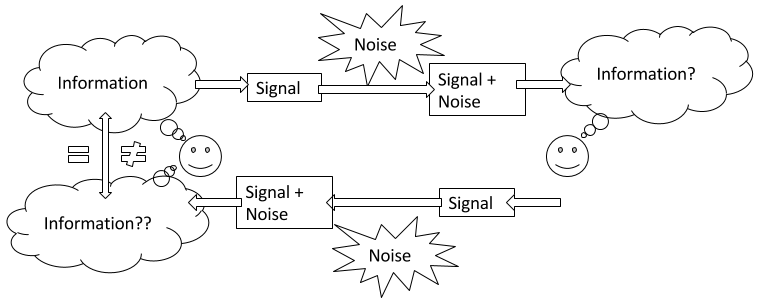
The confirmation brief method of error detection can be initiated by the sender of the information, or by the recipient. Also note that saying “I understand” is insufficient to be considered a confirmation brief as it allows for no comparison by the sender.
So, how do we correct encoding and decoding errors when two people are attempting to communicate with each other? For one, encoding and decoding are done by separate people. The error correction can happen (or can fail to happen) independently of the sender and the recipient. The mechanism of encoding and decoding typically involves assumptions about what the other person means to communicate and how they mean to communicate it. The sender, chooses words2 and other media to encode information into a signal and using confirmation brief observes how effectively the recipient understood the intended information. When further clarification is needed, the sender can provide more detail, but alternatively, the sender can choose to encode information using different words, or different media in order to help the recipient understand. A good sender is a person who can modify their encoding to make continual progress in reducing the gap between what they intended to communicate and what they receive in the confirmation brief. Similarly, on the receiving side, a good receiver is a person who can modify their decoding to make continual progress in reducing the gap between what they provide in the confirmation brief and what the sender intends to communicate. The sender confirms understanding once the sender decides that the confirmation brief is close enough to what they intended to communicate.
In brief, “focus on communication” requires participants to have a mental model for communication and awareness of all sources of error that can impede communication. Participants should continually strive to improve the repertoire of encodings and decodings available to them. Effective communicators should continually strive to improve the methods for constructing and adapting information encoding and decoding processes.
Endnotes
1 What I present here is a human-centric simplification of Claude E. Shannon’s ideas that gave rise to the field of Information Theory. For his seminal paper and a much more detailed treatment of communication see C. E. Shannon (1948). A Mathematical Theory of Communication. The Bell System Technical Journal, Vol. 27, pp. 379–423, 623–656, July, October, 1948.
2 Notice that emergence of a context-specific jargon is a mechanism for reducing encoding and decoding errors by defining a dictionary of words and their context-specific meanings ahead of communication. However, it only works if the interpretation of the jargon meanings actually matches between sender and receiver. Furthermore, in order to arrive at the common interpretation of jargon, sender and receiver still need to go through the communication process to establish the common interpretation in the first place.
How To Do Things

Marvel Entertainment (2016). Marvel’s Guardians of the Galaxy – Trailer 2 (OFFICIAL). Retrieved 5 Dec 2016
For as long as I remember, I was interested in the question of how I should do things. I assume that some form of this question tugs at all of us and that each of us explores it to various depths depending on what is going on in our individual lives. While I don’t think I’m done figuring things out, it seems to me, based on conversations with others, that I have assembled enough information that it is worth sharing.
We’ll start at the conclusion. Here it is, my answer to how I should do things.
I want to thrive in a complex world.
There is a lot to unpack, so let’s get to it.
First, the answer does not really seem like an answer at all. We have a how question that is answered by I want, what should we make of that? While I would like to claim some deep insight, I can’t. I sort of stumbled onto it. In retrospect, the reason I want works as an answer, has to do with the idea of obliquity, as defined by John Kay in his essay:
Strange as it may seem, overcoming geographic obstacles, winning decisive battles or meeting global business targets are the type of goals often best achieved when pursued indirectly. This is the idea of Obliquity. (…) Obliquity is characteristic of systems that are complex, imperfectly understood, and change their nature as we engage with them.1
So, my answer is oblique. However, while John Kay names the idea of obliquity, he does not provide a mechanism to determine what specific oblique approach to take for doing things. Also, notice that obliquity is a “characteristic of systems that are complex” (emphasis mine). There’s that word again, complex. It appears both in my answer to how I should do things, and in my very loose association with obliquity that I claim makes it ok for a how question to be answered with an I want answer. Complexity is indeed the key. In order to really understand what I want to thrive in a complex world means and why it is appropriate, it is important to understand complexity. What follows next is an exposition of the idea of complexity through the lens of my personal journey to understand it.
A Non-Complex System
For contrast, before we begin to define complexity, let’s first examine a simple, non-complex system. Consider the following sequence of numbers:
4, 5, 6, 7, 8, 9, 10, …
The “…” symbol at the end indicates that the sequence continues indefinitely. We observe that the sequence starts with “4”. To learn the next item in the sequence, we observe that we can add “1” to the previous number “4 + 1 = 5”, and we get “5”. Once we are at “5”, we observe that to learn the next item in the sequence, we can add “1” to it “5 + 1 = 6”, and we get “6”. Once we are at “6”, we observe that to learn the next item in the sequence, we can add “1” to it “6 + 1 = 7”, and we get “7”, and so on.
Now consider the following question:
What will be the number that is 50 places after “10” in the sequence?
We could, beginning with “10”, add “1”, and repeat that 50 times. However, because this is a non-complex system, we can analyze it and arrive at a shortcut of “10 + (1 * 50) = 60”. The number in the 50th place after “10” in the sequence is “60”. This is a crucial point. We did not have to calculate every step in the sequence between “10” and “60” in order to arrive at “60”. Because this is a non-complex system, we can analyze it and predict any item in the sequence without going through the entire sequence step by step.
Measurement Error In A Non-Complex System
Let’s imagine that the sequence we’ve been working with was measured from some real system and our measurements have error associated with them. For this example, we’ll assume our measurements are accurate to within 0.1. The sequence now is something like:
4.1, 5.1, 5.9, 7.0, 8.1, 8.9, 10.1, …
With this measurement error, our analysis would not end up with a rule to add “1” to the previous number, but instead we would use the mean (average) of the differences between the numbers in the sequence.
5.1 – 4.1 = 1.0
5.9 – 5.1 = 0.8
7.0 – 5.9 = 1.1
8.1 – 7.0 = 1.1
8.9 – 8.1 = 0.8
10.1 – 8.9 = 1.2
…
In this case, let’s assume that the mean turns out to be “1.0” with a standard error of “+/- 0.1”.
Notice that despite the measurement error, we can still figure out the number that is 50 places after “10” in the sequence using our shortcut of “10.1 + (1.0 * 50) = 60.1”. The standard error is “0.1 * 50 = 5”. The number that is 50 places after “10” in the sequence is “60 +/- 5”. The margin of error contains our ideal “60”. What about the number that is 100,000 places after “10” in the sequence? “10.1 + (1.0 * 100,000) = 100,010.1”. The standard error is “0.1 * 100,000 = 10,000”. We get “100,000 +/- 10,000”, and the margin of error contains our ideal “100,010”. The original measurement error does not hinder our ability to predict items in the sequence without going through the entire sequence step by step. We still get meaningful results, and we can meaningfully quantify how much error is in our prediction.
Furthermore, if we were to measure our system again, and assuming again that our measurements are accurate to within 0.1. Another sequence of measurements could be something like:
3.9, 4.9, 5.9, 7.1, 8.1, 8.9, 9.9, …
Using the measurements above, let’s assume our analysis again ends up with a rule to add “1.0” with a standard error of “+/- 0.1”.
When we want to figure out the number that is 50 places after “10” in this new sequence, based on our previous analysis, we can calculate “9.9 + (1.0 * 50) = 59.9”. The standard error is “0.1 * 50 = 5”. We get “60 +/- 5”, with the margin of error containing our ideal “60”. What about the number 100,000 places after “10”? We calculate “9.9 + (1.0 * 100,000) = 100,009.9”. The standard error is “0.1 * 100,000 = 10,000”. We get “100,000 +/- 10,000”, and the margin of error contains our ideal “100,010”. So, not only do we continue to get meaningful results, our predictions continue to lead us to similar results (within the margin of error) despite our initial error in measuring “10” in the sequence.
In summary, a non-complex system is predictable. It is predictable in a way that we can determine (within the margin of error) what the system will look like any number of steps in the future, without going through every step between our starting point and our prediction. Additionally, a non-complex system is predictable in a way that multiple predictions of the system any number of steps into the future will be close to each other (within the margin of error) despite starting with slightly different initial values due to measurement error.
A Complex2 System
In order to show an example of a complex system, we’ll have to get a little more… well, complex. I will present a set of equations, but then, to illustrate the complexity of the system we will look at a visual simulation. While the underlying details will be mathematically sound, I will avoid mathematics as much as possible. Instead, I will explain this complex system in terms of visuals.
First, the equations describing a deterministic complex system:
dx/dt = 10(y – x)
dy/dt = x(28 – z) – y
dz/dt = xy – 2.66z
The above equations describe a Lorenz system3, developed in 1963 as a simplified mathematical model for atmospheric convection (how air moves in the atmosphere). Here is what the system looks like when graphed over time (the animation starts over after twenty seconds):
This and similar animations below were captured using https://highfellow.github.io/lorenz-attractor/attractor.html. Retrieved 5 Dec 2016.
What we are seeing is the values of x and y graphed over time. The center of the animation corresponds to x = 0, y = 0, and z = 0. To the left of center are negative x values. To the right of center are positive x values. Below the center are negative y values. Above the center are positive y values. This animation only shows x values (horizontal axis) and y values (vertical axis). The z values are not depicted. The animation starts with values x = 0.1, y = 0.1, and z = 0.1. The line drawn gives us some intuition about what shape the system takes over time.
Before we go on, let’s highlight the first important aspect of a complex system. Given this Lorenz system example, starting with x = 0.1, y = 0.1, and z = 0.1, consider the question:
What will be the x, y, and z values 50 time steps after start?
If you recall, in our non-complex system example, we were able to analyze the system and determine that all we were doing was adding “1” at each step. This analysis gave us a shortcut to compute the state of the system 50 steps ahead without having to go through every step. Instead, we used our shortcut of “start + (1 * 50) = answer”. The first important aspect of a complex system is that such a shortcut does not exist.
What this means, is that in order to figure out what the x, y, and z values are 50 steps after start, we have to go through (that is, calculate) each one of the 50 steps to get the answer. Similarly, to figure out what the values are 100,000 steps after start, we have to go through all 100,000 steps to get the answer. The only way to see what the system will do (in this example, what will be the x, y, and z values at some point in the future) is to either observe the system, or to simulate it, and see where it ends up.
Measurement Error In A Complex System
The next animation shows the same exact Lorenz system I described previously, but this time, the animation shows only part of the line drawn. This animation draws the exact same values as the previous animation, but it shows only the most recent points instead of leaving the entire line drawn. This is so we can more easily see what I’m about to demonstrate next.
In order to illustrate what happens with an initial measurement error in a complex system, we will draw 20 systems together at the same time. The previous animation showed one Lorenz system of equations. This next animation shows 20 Lorenz systems of equations, each system of equations starting with exactly the same x, y, and z values (I will add measurement error in later animations). This animation is meant to demonstrate that if we start with exactly the same values, each step we calculate will be exactly the same. That is, all 20 systems will end up with the same x, y, and z values 50 steps from the start, 100,000 steps from the start, and so on. You’ll notice that the drawn points look thicker. This is meant to illustrate the 20 systems drawn all having the same value at the same point in time.
What happens if we introduce measurement error? In this example, the way I’ll demonstrate measurement error is to perturb the starting positions of x, y, and z of each of the 20 systems by a little bit. We will call this perturbation “spread”. We will use the following formula to adjust the starting point of x, y, and z:
x = 0.1 + (random(0, 1) * 2 * spread) – spread
y = 0.1 + (random(0, 1) * 2 * spread) – spread
z = 0.1 + (random(0, 1) * 2 * spread) – spread
random(0, 1) means a random number between 0 and 1. When we set “spread = 0.1”, one example of how much we’ll perturb the initial x value is 0.035241377710758706. This means, that x, instead of starting with 0.1, would in this case start with 0.1 + 0.035241377710758706 = 0.135241377710758706. We then similarly perturb starting value of y using a new random number between 0 and 1. We then perturb starting value of z. After we have perturbed values of x, y, and z, we use those as starting point for the first system (instead of x = 0.1, y = 0.1, and z = 0.1). We follow the same procedure for the remaining 19 systems.
With spread = 0.1, here is what the 20 systems look like:
spread = 0.1
Notice that the systems begin together, but after a while, we can see them drift away from each other. While the systems started really close together, pretty soon, each system ends up arbitrarily far away from all the other systems. This illustrates the other crucial aspect of complex systems. Where the system ends up in the future is highly sensitive to where the system starts. Tiny differences in start conditions can lead to arbitrarily large differences in where the systems end up.
To illustrate this point further, let’s see what happens if instead of perturbing initial systems with spread = 0.1, we make the perturbations smaller. In other words, what happens if the 20 systems begin closer together?
Below is an animation with “spread = 0.01” (ten times less spread than before):
spread = 0.01
Below is an animation with “spread = 0.001” (ten times less spread than before):
spread = 0.001
Below is an animation with “spread = 0.0001” (ten times less spread than before):
spread = 0.0001
Below is an animation with “spread = 0.00001” (ten times less spread than before):
spread = 0.00001
Below is an animation with “spread = 0.000001” (ten times less spread than before):
spread = 0.000001
Next is an animation with “spread = 0.0000001” (ten times less spread than before, one million times less spread than our first perturbation). This means that the system starting positions are only changed by a tiny amount, somewhere around 0.0000001. For example, instead of x = 0.1 at start, we would have x = 0.10000003385421758612446 at start. This is also a good time to consider what measurements are you capable of with this level of accuracy? Here’s what 20 systems look like with this tiny level of initial starting position difference:
spread = 0.0000001
In fact, no matter how small the difference in the initial start position, if there is any difference at all in the initial start position, our 20 simulated Lorenz systems will end up arbitrarily far away from each other. This is profoundly important. Imagine that one of these 20 Lorenz systems is the real system, and the other 19 systems are our simulations of the real system (so that we can try to predict what happens in a real system). This sensitivity to differences in the initial start position means that if there is any error at all in our measurement of the real system, our simulations will diverge arbitrarily far away from what the real system will do.
Properties Of A Complex System
I hope at this point, I have demonstrated two important properties of complex systems:
- There are no shortcuts to figure out where a complex system will end up in the future. We have to either observe the system itself, or simulate every step of its evolution.
- If there is any measurement error between a real complex system and our simulation of it, our simulation of it will diverge arbitrarily far away from the real system.
So far, I have demonstrated systems in form of abstract mathematical examples. The intent behind this is to demonstrate how complexity arises even in an ideal system where we know (because we define) everything about the system. The world has many more components, features, and types of interactions than the systems I described thus far. The world is much more complex. How can we, as humans, make sense of the complexity in the world around us?
A Human Lens On Complexity
The mathematical examples above are too abstract to inform my daily decisions as a human being. To actually make sense of the world and to make decisions in the world, I needed a different model. This is where I found Dave Snowden’s sense-making4 Cynefin5 framework to be useful.
Cynefin framework offers decision models depending on the nature of the system under consideration from the observer’s point of view. The nature of systems is considered from the perspective of domains. Cynefin framework offers the Ordered domain, Complex domain, Chaotic domain, and the domain of Disorder. Furthermore, the Ordered domain is divided into Simple and Complicated domains. See the figure below (the center unlabeled area is the domain of Disorder).
Snowden, Dave (2010). The Cynefin Framework. Retrieved 5 Dec 2016
As before, prior to considering the Complex domain, let’s discuss simpler domains of the Cynefin framework for context.
In systems that appear to the observer to belong to the Simple domain, cause and effect relationships exist, are predictable and are repeatable. The observer perceives this cause and effect relationship as self-evident. An applicable decision model here is Sense-Categorize-Respond. This is the domain where application of Best Practice is valid. Best Practice implies that there is the best approach to respond with.
In systems that appear to the observer to belong to the Complicated domain, cause and effect relationships exist but are not self-evident, and therefore require expertise. An applicable decision model here is Sense-Analyze-Respond. The domain requires analysis in order to decide a course of action. This is the domain where application of Good Practice is valid. The difference between Good Practice and Best Practice is such that Good Practice consists of multiple approaches where each are valid given some level of expertise. This is in contrast with Best Practice, where there exists the best approach.
The Ordered domain (Simple and Complicated) corresponds to the mathematical example of a simple system discussed previously where cause and effect are predictable. What corresponds to the mathematical example of a complex system is the Complex domain, where cause and effect are not predictable.
In systems that appear to the observer to belong to the Complex domain, cause and effect relationships are only obvious in hindsight, with unpredictable, emergent outcomes. An applicable decision model in the Complex domain is Probe-Sense-Respond. Probing is conducted through safe-to-fail experiments. If we sense the experiment is pushing the system towards a desired outcome (succeeding), our response is to amplify it. If we sense the experiment is pushing the system towards undesired outcome (failing), our response is to dampen it. The experiment shouldn’t be conducted without identification of amplification and dampening strategies in advance. Otherwise, we will not be able to exploit desirable outcomes or dampen the undesirable ones. This amplification and damping of safe-to-fail experiments leads towards an Emergent Practice, novel and unique in some way.
In systems that appear to the observer to belong to the Chaotic domain, no cause and effect relationships can be determined. An applicable decision model in the Chaotic domain is Act-Sense-Respond. The goal is to stabilize the situation as quickly as possible.
The domain of Disorder is the perspective of not knowing which domain the system being observed is in.
Another important aspect of the Cynefin framework is the transition between the Simple domain and the Chaotic domain. Unlike transitions between other domains, it is useful to think of a transition from Simple to Chaotic domain as falling from a cliff.
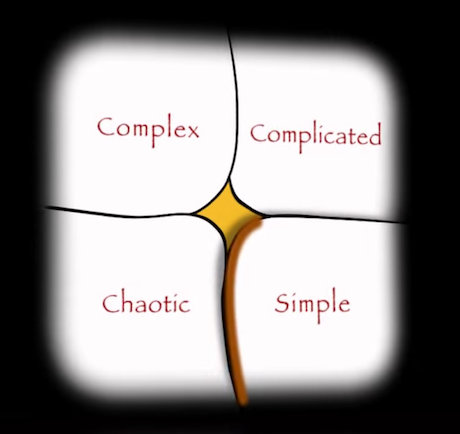
Snowden, Dave (2010). The Cynefin Framework. Retrieved 5 Dec 2016.
This indicates the danger of the Simple domain perspective that can lead to overconfidence in the belief that systems are simple, that systems are predictable, that past success guarantees future success, etc. In such case, the system drifts towards the transition and can enter the Chaotic domain in form of an unforeseeable crisis, accident, or a failure, where recovery is expensive. This transition area can be thought of as the “complacent zone.”
Notice that in discussing Cynefin domains, I have framed everything from the point of view of an observer. That is, the perception of the domain is dependent on who is doing the perceiving. Unfamiliar systems can appear Complex or Chaotic to one observer while being merely Complicated or Simple to another. While it may be possible that the systems themselves have intrinsic complexity, as in the mathematical complex system example discussed before, in order to make a decision, the perspective of the decision-maker is the only one available to the decision-maker. Hence, the way the decision-maker perceives the system domain dictates the decision model used.
With an intuition for complex systems and the context of the Cynefin framework, we can now meaningfully determine if we live in a complex world.
Do We Live In A Complex World?
One approach to determine whether we live in a complex world would be to consider the world from the perspective of a human-technology-nature system of systems. That is, humans exist in the world, and there exist human systems. Technology exists in the world, and there exist technology systems. Nature (not human and not technology) exists in the world, and there exist natural systems. Humans, technology, and nature interact, and there exist human-technology-nature systems. There are many of these human-technology-nature systems that interact together. Hence, the world can be thought of as a human-technology-nature system of systems. We can therefore attempt to determine what Cynefin domain describes the world.
Can the world be thought of as belonging to the Simple domain? While there may exist examples of human-technology-nature systems in the world where cause and effect are obvious (although I have a hard time coming up with any), every system in the world would have to belong to the Simple domain for us to consider the world in its entirety to belong to the Simple domain. This is not the case. We already demonstrated a system (Lorenz equations) that does not belong to the Simple domain, therefore, in order to thrive, thinking of the world as belonging to the Simple domain is insufficient.
Can the world be thought of as belonging to the Chaotic domain? Recall that the Chaotic domain was defined as the domain where there is no relationship between cause and effect. In general, we assume there exist causes and effects, and we do actually perceive relationships between cause and effect in the world. Therefore, in order to thrive, thinking of the world as belonging to the Chaotic domain is also insufficient.
So, in order to thrive, thinking of the world system of systems as belonging to the Simple domain, or the Chaotic domain, is insufficient.
Can the world be thought of as belonging to the Complicated domain? Recall that in a complex system, there are no shortcuts to figure out where a complex system will end up in the future and that any measurement error between a real complex system and our simulation of it will diverge arbitrarily far from the real system itself. We already demonstrated a system with these properties. Therefore, in order to thrive, it is insufficient to think of the world as belonging to the Complicated domain.
In order to thrive, it is necessary to perceive the world as belonging to the Complex domain. While it is true that some systems in the world may present themselves as belonging to the Simple, Complicated, or Chaotic domains, the world system of systems does demonstrate causes leading to effects (even if only in retrospect) and the types of interactions that exist are complex enough to need an explanation other than Simple or Complicated.
The Cost Of Being Wrong
What if the world does not belong to the Complex domain? What would be the cost of our mistake as compared to the alternatives? Let’s consider the question whether we live in a complex world from the perspective that we actually want to use the answer to pick a decision-making approach.
What is the utility of perceiving the world as belonging to the Simple domain? Simple domain implies the Sense-Categorize-Respond mode of decision-making. While this is a very simple and quick decision-making model, it will lead us astray if the system we are interacting with belongs to one of the other domains (Complicated, Complex, or Chaotic). I can’t think of any examples of self-evident human-technology-nature systems. Additionally, there is a danger of the Simple domain perspective that leads to an unforeseeable transition to the Chaotic domain resulting in an expensive crisis.
If we perceive the world as belonging to the Chaotic domain, that implies Act-Sense-Respond mode of decision-making. This is a very immediate mode of operation concerned only with the present and the desire to exit the Chaotic domain as soon as possible. Recall that the Chaotic domain was defined as the domain where there is no relationship between cause and effect. We just do, until the situation stabilizes. While this is a valid way to model the world, we typically want more from our approach to deciding in the world than just doing things without expecting we will have some desirable effect.
What is interesting about the Simple and Chaotic domains is that they tend to reflect the observer’s lack of understanding of the system. I mentioned already that I can’t think of real examples of Simple systems. Placing a system in the Simple domain seems to be a simplifying assumption to enable us to consider interactions of more systems than we would be able to otherwise. However, as mentioned before, there is a risk associated with the Simple domain resulting in expensive crisis. On the other hand, placing a system in the Chaotic domain seems to be done from position of ignorance. That is, we do not understand the cause and effect. We inherently do believe that there exist causes and effects in the world. A system in the Chaotic domain therefore, seems to tell us more about perspective of the observer rather than of the system itself. From this point of view, choosing to approach the world from the perspective of Chaotic domain (as opposed to being forced into it) seems to be a choice of willful ignorance. The cost of willful ignorance seems higher than other approaches, but more importantly, it is insufficient in order to thrive in the world.
Perceiving the world to be in the Complicated domain implies that given enough analysis, we can predict what will happen in the future. The decision-making mode applicable is Sense-Analyze-Respond. This is where after analysis, we have a Good Practice which we can reuse to exploit the system we are interacting with. This is a less-costly approach than Complexity domain’s Probe-Sense-Respond (which results in an Emergent Practice), but only if our analysis is correct and the system ends up in the state we predicted it should. Herein lies the problem of using Complicated domain approach. It works until it doesn’t. It implies that we understand everything there is to understand about the system and that we know what will happen to the system in the future. Much like Simple domain simplification can lead to an expensive crisis, so can Complicated domain not-as-much-simplification approach lead to an expensive crisis. This happens when the system is influenced by factors that we failed to analyze. For example, consider stock market crashes, car accidents, deadlines, unintended consequences of any kind, etc. The existence of insurance indicates that Complicated domain assumption is insufficient.
If we perceive the world as belonging to the Complex domain, it implies the Probe-Sense-Respond mode of decision-making. We expect the unexpected. We attempt to dampen or reinforce the unexpected results of our probes in course of ongoing safe-to-fail experiments. This is a more costly approach if the system turns out to belong to the Complicated domain for some time period. There is also the difficulty of determining what is safe-to-fail. What is safe-to-fail for a tribe, for example, having one person taste some new plant that the tribe stumbled across, may not be safe-to-fail for the person doing the tasting if the plant turns out to be poisonous. Determination of what is safe-to-fail in the first place itself requires a Probe-Sense-Respond mode of decision-making. The mistakes made from a Complex decision-making approach are in a sense, more aware, than those made from a Complicated decision-making approach. In Complex domain approach, we are aware we can make mistakes (failed experiments), whereas in a Complicated domain approach, mistakes are unforeseen when, eventually, the Complicated domain assumption turns out to be invalid once the perceived system is influenced by factors that were not part of analysis in scope of Complicated domain’s Sense-Analyze-Respond decision-making.
The cost of assuming the world belongs to the Complex domain is less than assuming otherwise.
How To Do Things
It is necessary to think of the world as Complex, and it is insufficient to think of the world as Simple, Complicated, or Chaotic. To thrive in the world, it is necessary to wield the Probe-Sense-Respond mode of decision-making. It is necessary to conduct safe-to-fail experiments, amplifying desired outcomes and dampening undesirable ones. This implies optimizing for learning. To optimize for learning, it is useful to focus on systems awareness, communication, and minimizing feedback loops. Because we are people, it is also useful to remember that people are the ones who do the things.
Endnotes
1 Kay, John (2014). Obliquity. Retrieved 5 Dec 2016.
2 In this example, I am using the word “complex” to describe, what in mathematics, is called “chaos”. Part of the difficulty of understanding complexity is due to different words being used in different domains of our knowledge to describe the same thing. Because in non-mathematical contexts the word that is used is “complex”, I am sticking with “complex” here for the sake of consistency.
3 See https://en.wikipedia.org/wiki/Lorenz_system. The parameters picked here are specifically the ones resulting in chaotic solutions to the Lorenz system.
4 There is an important distinction between a categorization framework and a sense-making framework. In a categorization framework, framework precedes data. In a sense-making framework, data precedes the framework. Sense-making is “a motivated, continuous effort to understand connections (which can be among people, places, and events) in order to anticipate their trajectories and act effectively”. See: Klein, G., Moon, B. and Hoffman, R.F. (2006). Making sense of sensemaking I: alternative perspectives. IEEE Intelligent Systems, 21(4), 70–73.
5 Snowden, Dave (2010). The Cynefin Framework. Retrieved 5 Dec 2016. Also see: Snowden, Dave (2009). How to organize a Children’s Party. Retrieved 5 Dec 2016.
