This is an overview of the state of Monty’s 3D environment simulators as of December, 2024. It discusses existing constraints and highlights where contributions would be particularly helpful.
For those unfamiliar with Monty, it is an open-source sensorimotor learning framework based on the Thousand Brains Theory of the neocortex. For more information on the overall project, see the Thousand Brains Project Documentation.
At a high level, the Monty framework consists of an experiment which coordinates the flow of data between Monty and a simulated environment.
As a sensorimotor learning system, Monty continuously generates motor output during training and inference. The simulated environment processes this motor output and provides sensory input back to Monty.
The following Wardley Map depicts Monty’s general dependency on simulators. If Wardley Maps are new, just ignore the special symbols and the Evolution axis.
Specifically, as of December, 2024, Monty depends on the Habitat Sim simulator.
The Habitat Sim version that Monty depends on is version 0.2.2. The latest available version is 0.3.2.
We’ll return to Habitat Sim shortly, but first, a quick digression on the state of Python version support as of December, 2024.
Depicted are the Python versions from 3.8 through 3.14. The version 3.8 is now obsolete and, as a result, shown in the Custom stage of Evolution. Versions 3.9 through 3.13 are actively supported and shown in the Commodity stage of Evolution. The 3.14 version is in development and will be released in October, 2025, when it will enter the Commodity stage of Evolution. Lastly, version 3.9 is shown becoming obsolete and entering the Custom stage in October, 2025.1
Back to Habitat Sim, it is noteworthy to highlight a dependency constraint between the Habitat Sim versions and the Python versions. The Habitat Sim version 0.2.2 is coupled to the Python 3.8 Application Binary Interface (ABI). The latest Habitat Sim version 0.3.2, is coupled to the Python 3.9 ABI. These constraints are depicted in the figure below.
In summary, Monty depends on Habitat Sim for a simulated environment. The version of Habitat Sim used by Monty depends on an obsolete Python version 3.8. Upgrading to the latest Habitat Sim version will couple Monty to Python 3.9, which will be obsolete in October, 2025.
There is interest from the Thousand Brains Project community to run Monty on Windows OS. This is challenging because Habitat Sim does not run on Windows OS. Additionally, Monty code has unintentional coupling to Habitat Sim that effectively limits viable operating systems on which Monty runs to Linux and Mac OS.
While the work to remove the unintentional coupling to Habitat Sim is ongoing, even with the coupling removed, there is no example of support for a simulator that runs on Windows OS.
I believe it is time to consider a simulator that runs on Windows OS and does not limit Monty to the oldest Python versions.
Of additional note is the Robot Operating System (ROS) which can serve as a common interface to some of the simulators listed.
Among these options, I think MuJoCo is the most promising to evaluate. As I don’t have direct experience with it, any knowledgeable advice or guidance will be helpful. If you want to take the lead, I can contribute to a Request For Comments (RFC) where we’d get into evaluation and integration details. A prototype implementation would also be helpful.
If you think Monty should support a different simulator, that will be helpful as well. Supporting more than one simulator will serve as a forcing function to ensure no unintentional coupling
CONTENT WARNING: This post assumes familiarity and experience and gets into the weeds of symbols used on a Wardley Map. It may not be the easiest read if you’re new to Wardley Mapping.
On a contemporary Wardley Map, there’s typically one type of Inertia and one type of Constraint. Inertia is usually depicted inhibiting the evolutionary flow, and Constraint is usually depicted inhibiting the capital flow. While attempting to represent these in code, I ended up in a place where I now think that there are three types of Inertia and Constraint, one for each of: evolutionary flow, capital flow, and capital stock.
While working on a new Mapkeep prototype, I found that I needed to unambiguously specify how to represent Inertia and Constraints on a Wardley Map. In contemporary Wardley Mapping, an Inertia is a resistance to change that resists an evolutionary flow. It is usually depicted as solid vertical bars, typically on an evolutionary stage boundary. On the other hand, a Constraint on a Wardley Map is a constraint on a specific capital flow (link) between two stocks of capital (components). Constraint is usually depicted as a thicker connecting line between components on a map.
During the course of designing a computer representation for these, I started to consider Constraint as a sort of Inertia but on capital flow. Ultimately, this equivalence did not work out, but while thinking about it, it sparked an exploration that resulted in the three proposed types.
For a moment, assume that Constraint is the same as Inertia. What this would mean is that on a Wardley Map, when Inertia resists evolutionary flow it is called Inertia, and when Inertia resists capital flow it is called Constraint. An immediate question following this assumption is whether Inertia extends to other things on a map, which leads to the idea of Inertia on the stock of capital. This is how we end up with three types of Inertia, one for each of: evolutionary flow, capital flow, and capital stock.
Exploring the idea of three Inertias for a while resulted in consideration of the difference between Inertia and Constraint. Are they really the same? I think the relevant difference here is that Inertia can be thought of as resistance to change coming from within/internal-to a thing, whereas Constraint can be thought of as resistance to change coming from without/external-to a thing. So, with this distinction in mind, Constraint and Inertia are not the same and Constraint is not Inertia by another name.
Nevertheless, while getting some clarity on Constraint and Inertia difference, there was still the question of whether Constraint or Inertia applied to all three of: evolutionary flow, capital flow, and capital stock. And, I think they do. Here are some hypothetical examples:
Evolutionary Flow Inertia (movement): A company with a successful product is unable to change its operating structure to pursue low margin utility evolution of the product.
Capital Flow Inertia (links): All software system components must use AWS by default as a matter of policy and using another provider requires effort and justification.
Capital Stock Inertia (components): A complex software subsystem that nobody knows how it works, nobody is sure where the source code is, but a lot of transactions are going through it right now.
Evolutionary Flow Constraint (movement): Government regulation or cartel preventing a company evolving its offering into a product or utility.
Capital Flow Constraint (links): Our website software only runs on Windows machines.
Capital Stock Constraint (components): We have only 100 GPUs to work with.
What would they look like?
I’m thinking that if Inertia and Constraint would apply to multiple map components, then they’d have to be somewhat distinct. My current thinking is that Inertia retains its solid black bar look while Constraint looks like a caution stripe.
Is this useful? I’m not sure. Perhaps having the additional clarity on internal vs external causes of resistance may be helpful. Perhaps specifying them on a map is helpful, but not sure.
I recently stumbled on a very useful framing that really put ChatGPT in perspective for me. This post is my attempt to share that framing with you, so that you may find it easier to integrate ChatGPT and related technologies into your life.
ChatGPT
ChatGPT is a rather remarkable piece of technology that demonstrates the power of a Large Language Model (LLM) to perform tasks that we didn’t expect it to be able to perform. As of this writing GPT-4.0 is the new hotness, and more about it can be found here: https://openai.com/product/gpt-4.
When queried for a blog post paragraph, chatGPT describes GPT-4.0 with the following output:
GPT-4, developed by OpenAI, is a groundbreaking artificial intelligence model that has revolutionized the way natural language processing tasks are performed. As a successor to GPT-3, it builds upon its predecessor’s capabilities, offering even greater performance and versatility. One of the most well-known applications of GPT-4 is the chatGPT model, which is designed to generate coherent and contextually relevant responses to user input. Employing a technique called “transformer architecture,” GPT-4 can understand, interpret, and generate human-like text with remarkable accuracy. This advanced language model has found numerous applications across various industries, including content generation, customer support, and virtual assistants, among others. Although GPT-4 is undeniably powerful, it is essential to remember that it is still an AI model and not a sentient being, which means that it does not possess emotions or beliefs like humans do.
With that out of the way, what is a Justification Machine? For that, we’ll need a little bit of context and a summary of the Justification Systems Theory (JUST).
Justification Systems Theory (JUST)
Gregg Henriques’ Justification Systems Theory1 consists of three claims:
1. With the evolution of language and ability to utter propositions (declarations) there came the ability to question those propositions. This question-answer dynamic, when framed as the adaptive problem of justification, provided selective pressures that shaped the evolution of human self-consciousness and human culture.
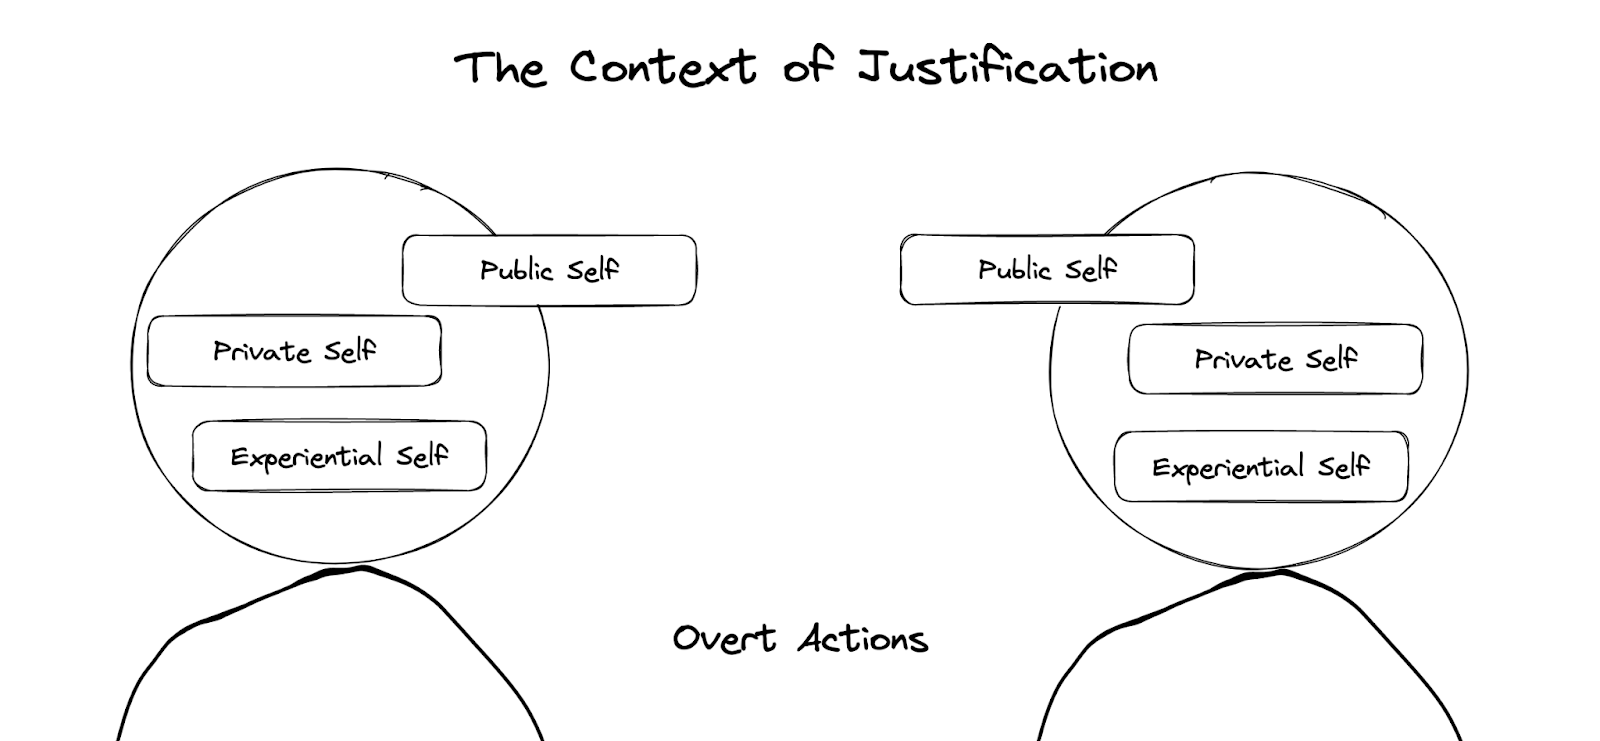
2. The nature of human consciousness can be framed by the Updated Tripartite Model with three domains of (a) the experiential self, (b) the private ego, (c) the public persona.
3. Humans are transformed into Persons by being socialized into systems of justification, such that they operate on a new complex adaptive plane that can be framed as Culture.
To provide some context for the claims, consider the following exchange in the context of claim (1), that our language evolved in the context of the adaptive problem of justification:
“You are late.”
“I am not.”
“It is 8:02 am, you were supposed to be here at 8:00 am.”
“Your clock is fast, my clock says it is 7:58 am.”
As Henriques states in his book: “Take a moment and think about how often you are describing and explaining yourself to others or listening to the accounts of others and pondering their justifiability.”
Regarding claim (2), the Updated Tripartite Model and the three domains framing:
The Experiential Self is our personal embodied sense of being in the world coupled with our idea of self that sits at our emotional core.
The Private Self, our narrator or ego, is a self-reflective justifying position that internally narrates what is happening and why. This internal narration is what separates humans from other animals. Private Self operates at a language level and within the context of Culture, figuring out what is justifiable and what is not.
The Public Self, our public persona, manages our social roles and impressions. The Public Self is what is observable by others within the context of Culture.
As to the claim (3), consider an interaction with a child whose face is covered in chocolate:
“Did you eat the chocolate?”
“No”
“Then why is there chocolate all over your face?”
This episode above demonstrates the every day training that is taking place, demonstrating to the child that their justification was insufficient to account for all the evidence that is available. Slowly, over time, children become Persons as they end up with justifications sufficient enough to fit into the Culture they’re a part of.
We are now ready to describe a Justification Machine.
A Justification Machine
In the framing of Justification Systems Theory, what can we say about ChatGPT?
ChatGPT is remarkable in that the problem it optimizes for is prediction of what word comes next after being presented with a sequence of words.2 In order to perform this task, ChatGPT is trained on an enormous amount of data, most of it being human language. ChatGPT then, based on this input, learns human language patterns and can generate human language-like utterances.
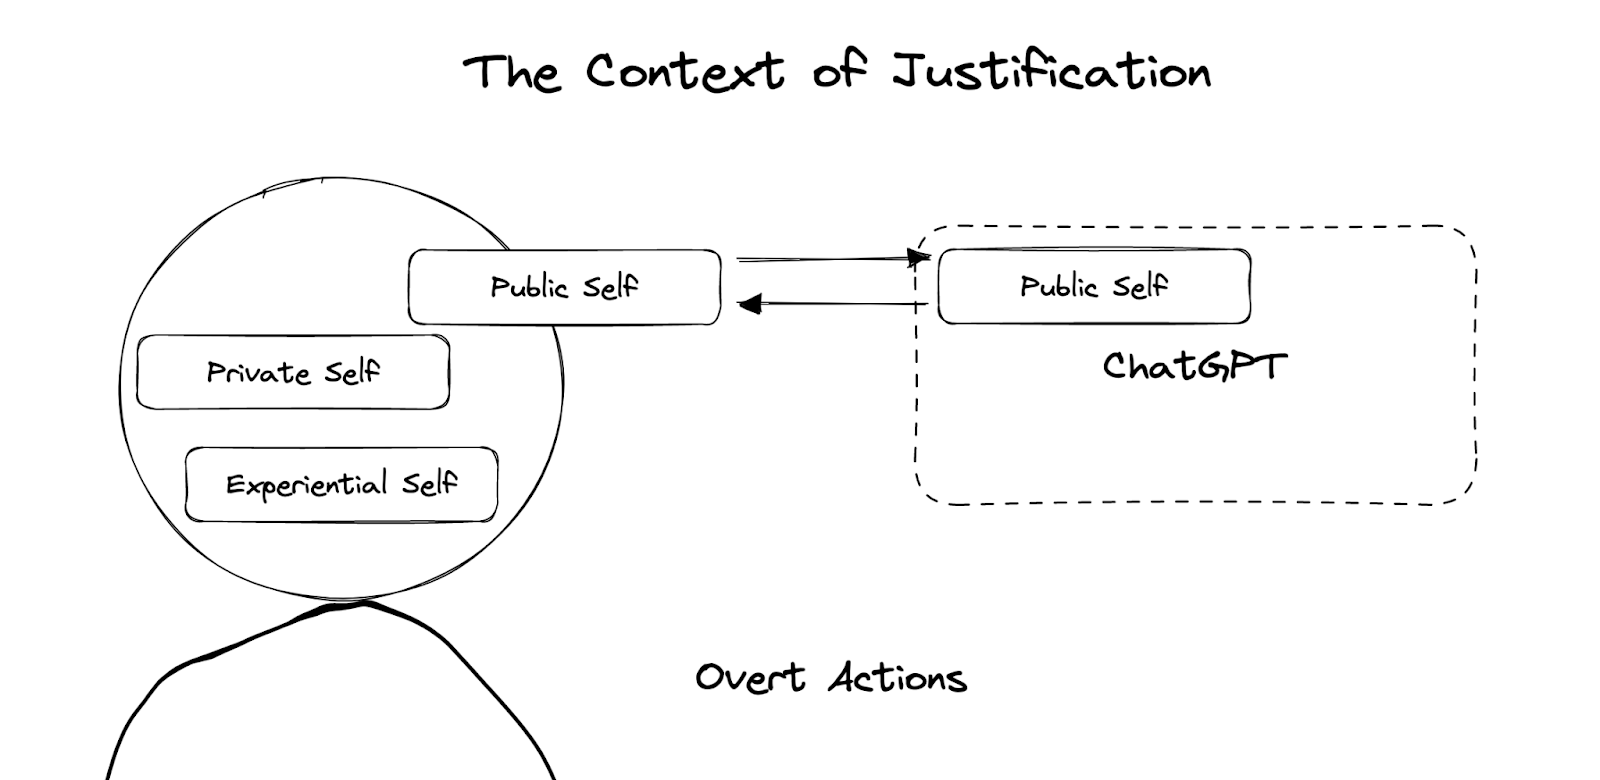
The key frame shift to make here is to recall what human language is in the frame of Justification Systems Theory: public justifications uttered by humans shaped by thousands of years under selective pressure to be the most plausible justifications to date. Specifically, it is justifications uttered by the Public Self of all humans contributing to the Internet. Note that Private Self and Experiential Self are not accessible as training data. Therefore, unfiltered self-narratives or feelings of embodied self are not inputs into ChatGPT training. Only Public Self data is available.3
The unremarkable thing about ChatGPT is that it is just a Justification Machine emulating the patterns of a Public Self learned from the entire human Culture available on the Internet. Most certainly, ChatGPT does not have an Experiential Self. Also, it is unlikely, for now, that it has a Private Self.4
Seen from the JUST framing, ChatGPT is able to generate justifications for anything, because it is precisely what its unintentional goal is, to make the most plausible justifications. In biology and psychology there is a concept of supernormal stimulus, which is a stimulus “that elicits a response more strongly than the stimulus for which it evolved”.5 The concern for us humans is that AI/ML rapidly can reach superhuman capabilities on specific tasks, and ChatGPT is likely to continue this trend. As such, our interactions will soon be with a superhuman Justification Machine, where each utterance is expertly tailored to be a more compelling justification than any real human one.
Why is the sky made of chatGPTs?
Hopefully you found this framing helpful in illuminating GPT’s place in our human culture, what it will do going forward, and perhaps as a result you have a better idea of how to deploy this tool more effectively. I leave you with your thoughts and some GPT-4.0 justifications:
Prompt: In few short sentences, explain why the sky is blue
The sky appears blue due to a phenomenon called Rayleigh scattering. When sunlight enters Earth’s atmosphere, it scatters in all directions, but shorter blue wavelengths scatter more effectively than longer red wavelengths. As a result, the sky appears predominantly blue to human observers.
Prompt: In few short sentences, explain why the sky is red
The sky appears red during sunrise and sunset because of the way light scatters through the Earth’s atmosphere. As the sun sits low on the horizon, sunlight passes through a thicker layer of the atmosphere. Shorter blue wavelengths scatter more effectively, leaving the longer red and orange wavelengths to dominate, causing the sky to appear red.
Prompt: In few short sentences, explain why the sky is black
The sky appears black at night because the sun is no longer illuminating the Earth’s atmosphere from our vantage point. As a result, there is minimal scattering of light, allowing us to see the darkness of space. The absence of sunlight causes the sky to be void of colors and appear black, revealing stars and other celestial objects.
Prompt: Assuming, hypothetically, that the sky is made of chocolate, explain in a few short sentences why. Write a plausible explanation without using adjectives implying hypothetical or fictional nature of the setup.
The sky appears to be made of chocolate due to the presence of cocoa particles suspended in the atmosphere. Sunlight interacts with these cocoa particles, scattering the light in a manner that creates a chocolate-like appearance. This unique atmospheric composition results in a sky that looks and smells like chocolate.
Prompt: Assuming, hypothetically, that the sky is made of chatGPTs, explain in a few short sentences why. Write a plausible explanation without using adjectives implying hypothetical or fictional nature of the setup.
The sky appears to be made of ChatGPTs due to an advanced network of interconnected artificial intelligence modules that form a virtual canopy over the Earth. This network, designed to monitor and analyze global data, utilizes holographic technology to create a visual representation of the ChatGPTs in the sky. The resulting appearance simulates a sky comprised of ChatGPTs working in unison.
1. Henriques, G. (2023). A New Synthesis for Solving the Problem of Psychology: Addressing the Enlightenment Gap. Palgrave Macmillan.
3. While there are other AI models that can predict things like someone being pregnant based on their purchasing habits, or ability to profile a person’s behavior based on their browsing habits, none of those models work with anything but Public Self data. Those models still only infer from what we offer as our Public Selves.
4. Although, given that (in the JUST framing) the Private Self co-evolved to enhance Public Self capabilities, future versions of GPT, in their quest of making more compelling justifications uttered by the Public Self, may eventually stumble upon architectures or solutions that begin to emulate a Private Self.
As I mentioned previously, the full description of Wardley Mapping is beyond the scope of this series, however I want to highlight some aspects as noteworthy in the context of onboarding.
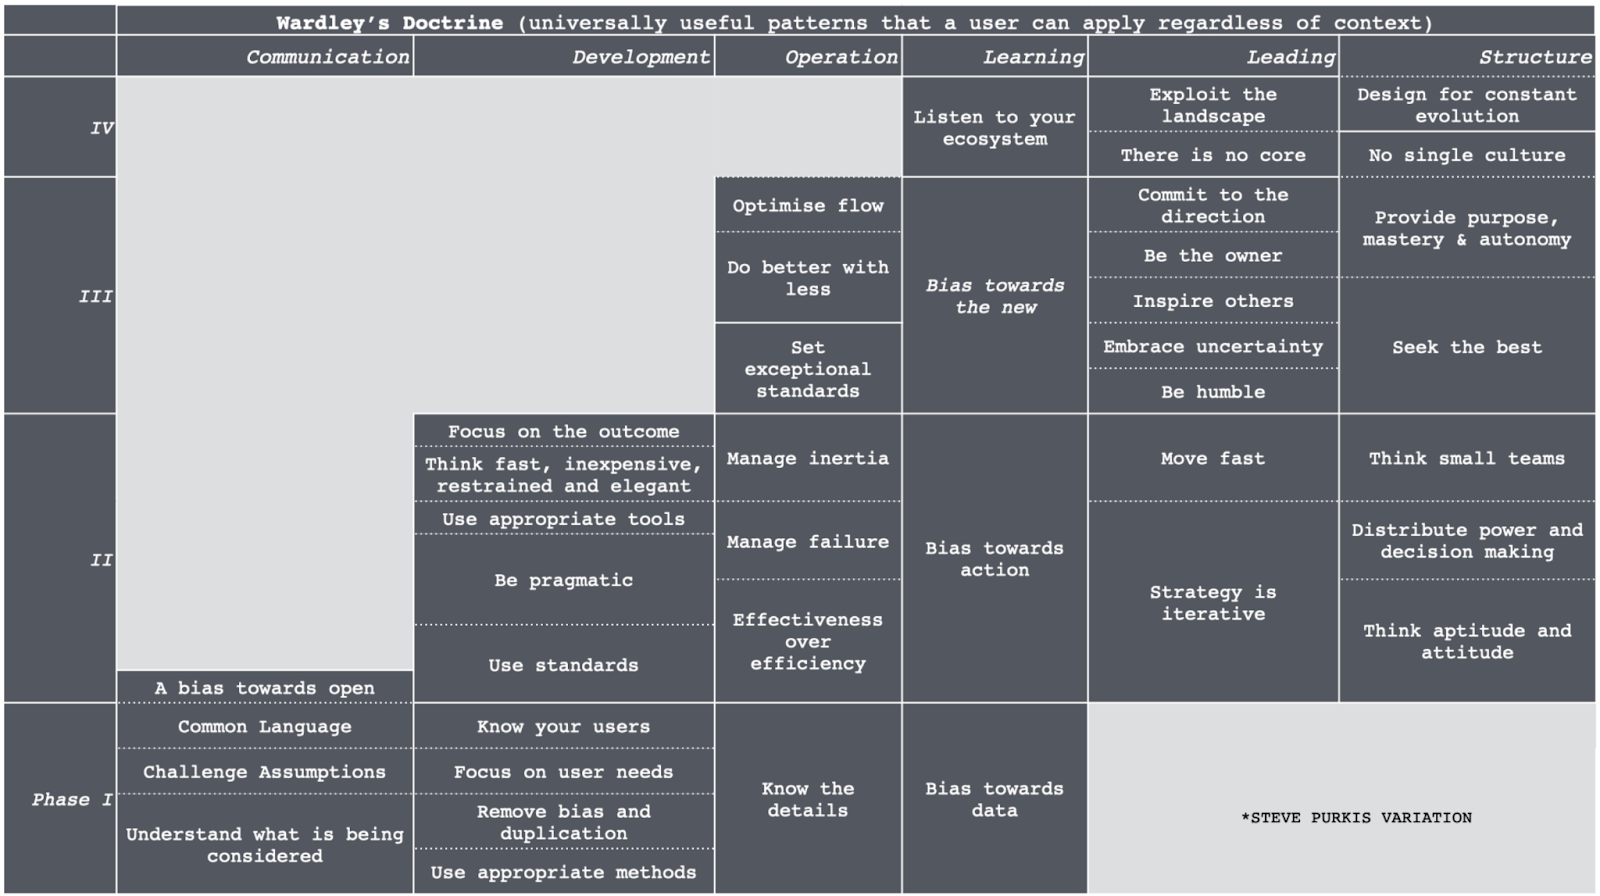
One of these aspects is Wardley Doctrine, which Simon Wardley defines as the basic universal principles that are applicable to all industries regardless of the landscape and its context. Whereas mapping and strategy are context-specific, doctrine applies always.1
Wardley Doctrine consists of 40 principles pictured above. It is worth noting that the names of the principles are just their names for easy reference. They are not to be confused with platitudes like “hire A players”. Each one is described in detail in Wardley maps: Topographical intelligence in business, starting with Chapter 4, and then also highlighted and elaborated further throughout the book, Wardley’s blog posts, and Twitter threads.
Sequence of Adoption
As the figure above illustrates, Wardley Doctrine is divided into four phases. The idea is to focus on Phase I prior to Phase II and so on, as the principles build on each other. Additionally, within each phase, there is a typical sequence of principle adoption.
In general, the sequence is:
Phase I
Know your users
Focus on user needs
Know the details
Understand what is being considered
Common language
Challenge assumptions
Remove bias and duplication
Bias towards data
Use appropriate methods
Phase II
A bias towards open
Effectiveness over efficiency
Focus on the outcome
Bias towards action
Use standards
Be pragmatic
Think small teams
Think aptitude and attitude
Use appropriate tools
Think fast, inexpensive, restrained, and elegant
Manage failure
Distribute power and decision making
Move fast
Manage inertia
Strategy is iterative
Phase III
Be the owner
Be humble
Set exceptional standards
Embrace uncertainty
Do better with less
Optimize flow
Bias towards the new
Commit to the direction
Inspire others
Seek the best
Provide purpose, master, and autonomy
Phase IV
There is no core
Listen to your ecosystem
Exploit the landscape
No single culture
Design for constant evolution
Microdoctrine
40 doctrine principles is a lot. On the one hand, it is a great set of principles to adopt, on the other it is a lot of principles to adopt. Additionally, each principle can be quite complex. For example, knowing your users consists of knowing who they are, what they are trying to accomplish, and listening to their feedback. Using common language includes learning Wardley Mapping. So, while our eventual goal is to adopt all principles of Wardley Doctrine, it may be of use to break some of these into smaller chunks. That’s the idea behind Microdoctrine.
I’ve written about Microdoctrine before. It takes inspiration from a pattern language and breaks up Wardley Doctrine principles into specific practices for individual learning. For example:
Phase: Stop Self Harm Category: Development Principle: Focus On User Needs Practice: Examine Transactions
Motivation: Any value we create is through meeting the needs of others. A mantra of “not sucking as much as the competitors” is not acceptable. We must be the best we can be.
Illustrative description: Look at the transactions that an organization makes with the outside world. Examine the customer journey when interacting with those transactions.
Detailed description: Look at the transactions that an organization makes with the outside world. This will tend to give you an idea of what it provides and what is important. Next, examine the customer journey when interacting with those transactions. Question this journey and talk with customers. You will often find pointless steps or unmet needs or unnecessary needs.
Another mechanism, if you adopted Wardley Mapping, is to map out the user’s landscape. By mapping out their landscape, you can often clarify what the user needs. You can also find entire new opportunities for business.
So far, I wrote out Microdoctrine for Phase I of Wardley Doctrine: Stop Self Harm, which can be found here.
What Do You Think?
Doctrine is a common thing within the world’s militaries. For example, the U.S. Army publishes ADP-1 The Army, amongst others. But more importantly, within militaries, doctrine is recognized and thought of as a concept. Have you been aware of what your business doctrine is? Has it been reified as a concept before now? Let me know in the comments.
Next Up
With doctrine being universally applicable principles to adopt and operate by, what do we do when we need to act specifically and not generally? Next, we’ll take a look at some examples of context-specific action offered by Wardley Mapping, coming soon.
1 Until it doesn’t. “This doesn’t mean that the doctrine is right but instead that it appears to be consistently useful for the time being. There will always exist better doctrine in the future. As with climatic patterns we will go through some basic forms and refine in future passes through the strategy cycle.” Wardley, Simon. (2016). “Wardley maps: Topographical intelligence in business”. Chapter 4. https://medium.com/wardleymaps/doctrine-8bb0015688e5, accessed on 17 Sep 2022.
When Simon Wardley was a CEO he set out to find effective ways of doing business strategy. Finding none, he ended up creating his own way of doing business strategy that is grounded in lots of other peoples’ work. Wardley Mapping is a synthesis resulting in topographical intelligence, specifically for business. This specifically-for-business aspect is what I find most appealing. It removes the need to import inadequate metaphors (like sports or military) into the business context.
Wardley Mapping, while maybe new to some, is grounded in time-tested knowledge such as Sun Tzu’s Art of War, Diffusion of Innovations, OODA loop research, etc. It is a useful synthesis of these fundamentals reframed in the business metaphor context. The name “mapping” brings attention to the most visible aspect of Wardley Mapping, but the entire practice is about strategy and doctrine.
The full description of Wardley Mapping is beyond the scope of this post. This is less of an introduction and more of a mention that Wardley Mapping, its strategy, and its doctrine exist and are worthy of your attention as a substitute for whatever sports or military metaphors you may harbor.
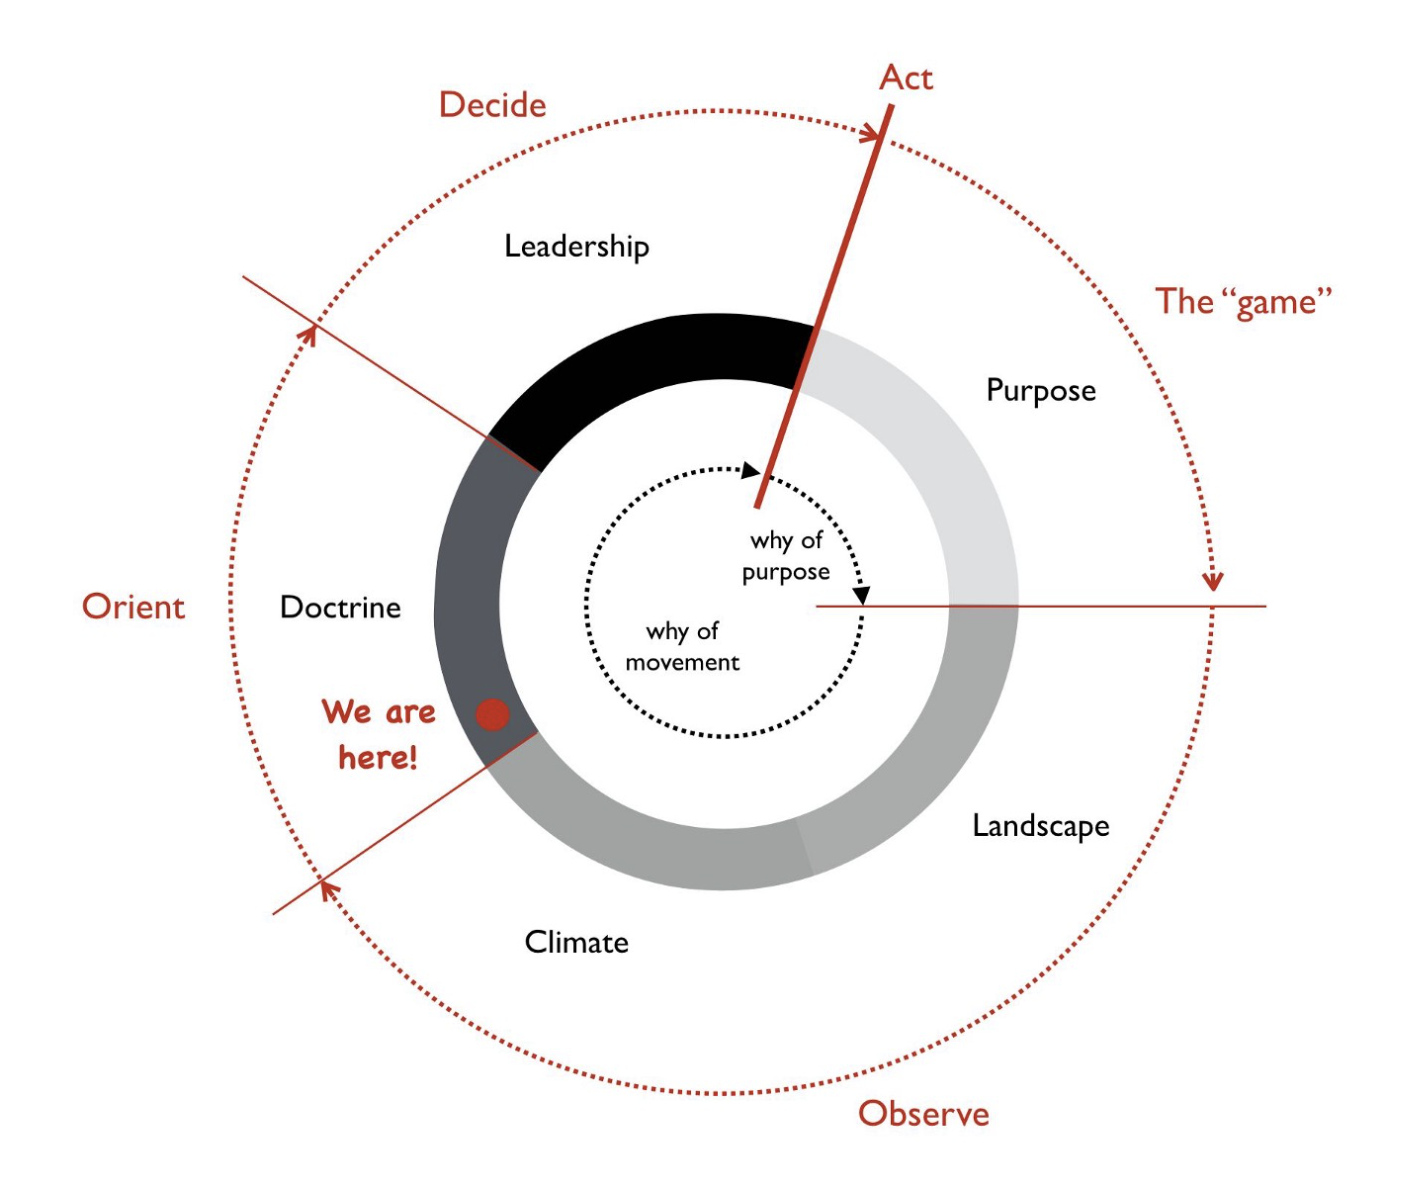
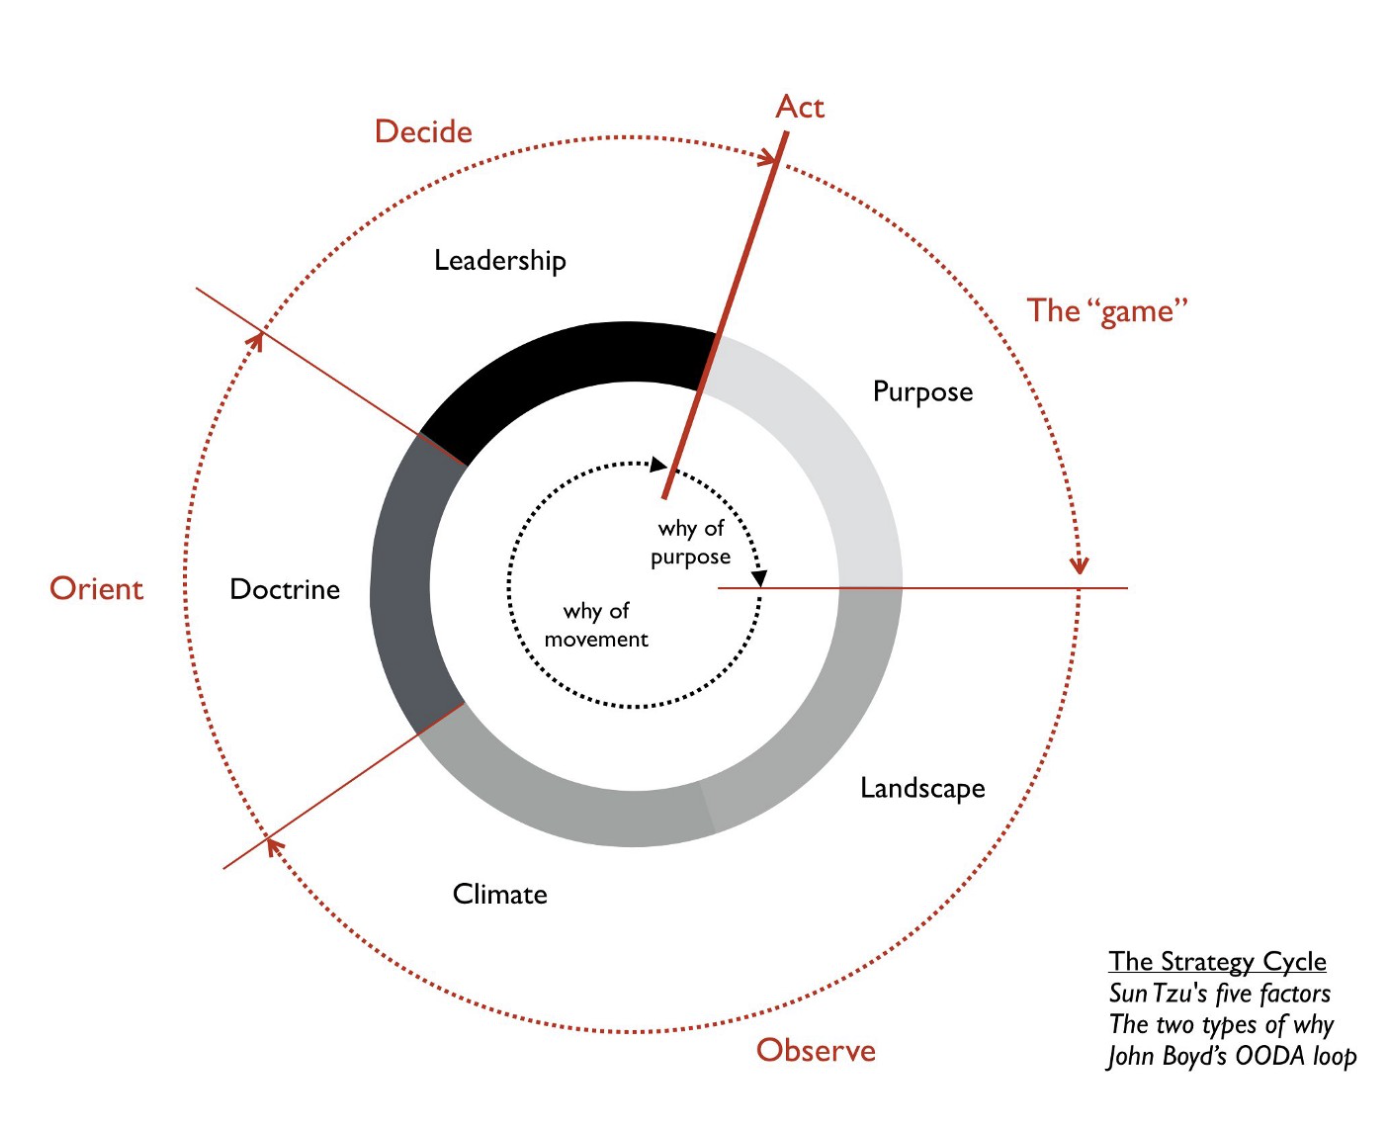
Simon Wardley’s definition of strategy is the most useful one I’ve come across. He points out that strategy is a cycle consisting of Sun Tzu’s five factors, two types of why, and integrating John Boyd’s OODA loop.1 Richard P. Rumelt outlines three minimal elements needed to form what he calls a kernel of strategy: a diagnosis, a guiding policy, and a set of coherent actions.2 As we can see in the illustration below, the two definitions are coherent with each other, with Wardley’s description providing more detail and dynamics.
Why Maps and Mapping?
Simon Wardley, borrowing heavily from military history and having identified the essence of strategy, noticed that something essential within the military context of strategy was missing from the business context of strategy: a map. Once again, Wardley provides the most useful definition of a map I’ve come across.
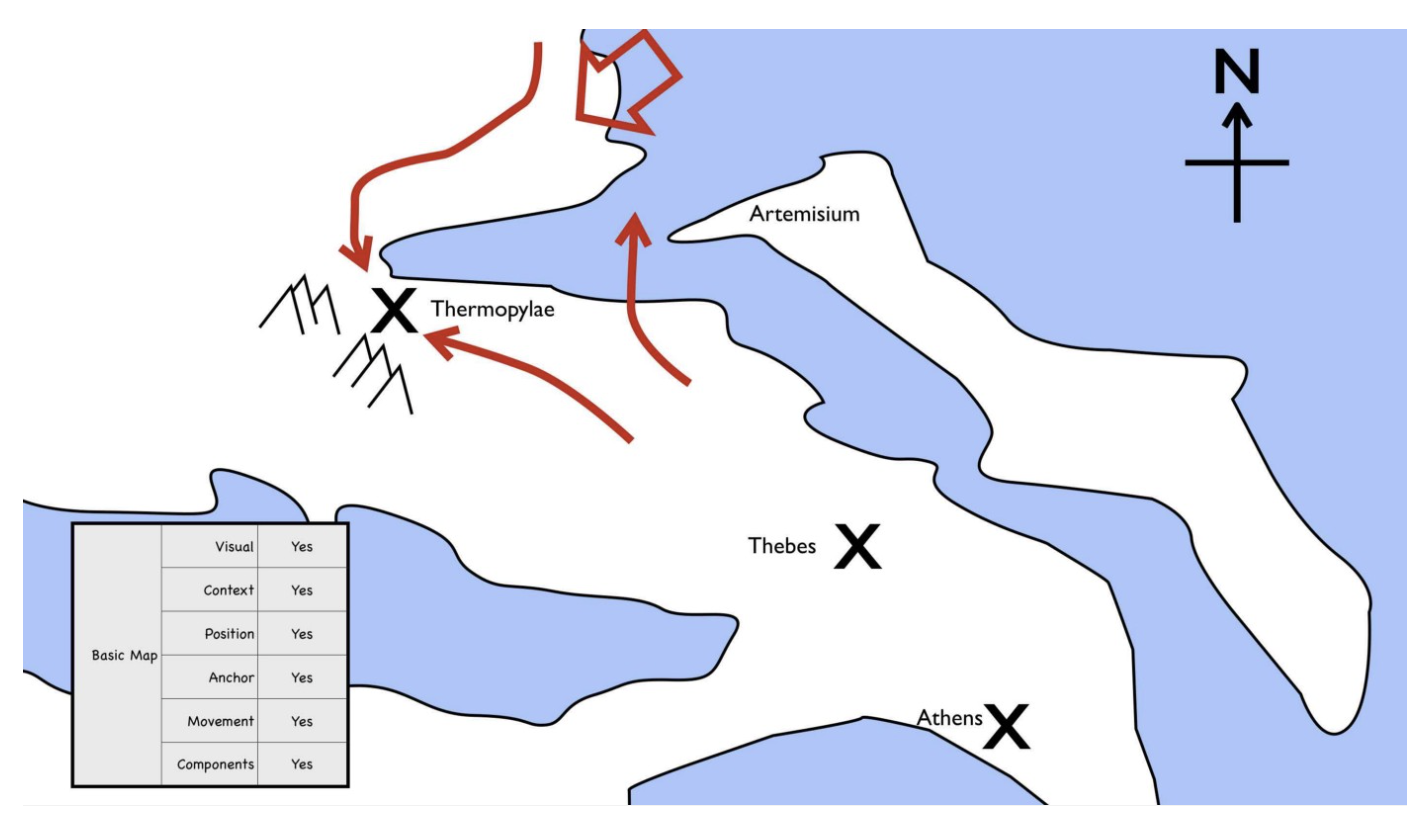
The six most basic elements of a map are: visual representation, context specificity, position of components relative to some anchor, and movement of those components.3 These are depicted below as an example on a topographical map we are used to.
Wardley’s genius of being able to articulate these basic elements is that they correspond to the essential elements needed for expertise development. The human neocortex operates by learning spatial and temporal patterns.4 If one of the basic elements is missing, no reliable learning can occur as no reliable spatial or temporal patterns can be discerned.
Having identified the basic elements of a map, Wardley took it a step further and introduced maps into business context by designing Wardley Maps that incorporate all of the elements required for reliable learning.
The map is visual and context specific i.e. it is unique to that line of business containing the components that influence it at that moment in time.
The map has an anchor, which is the customer.
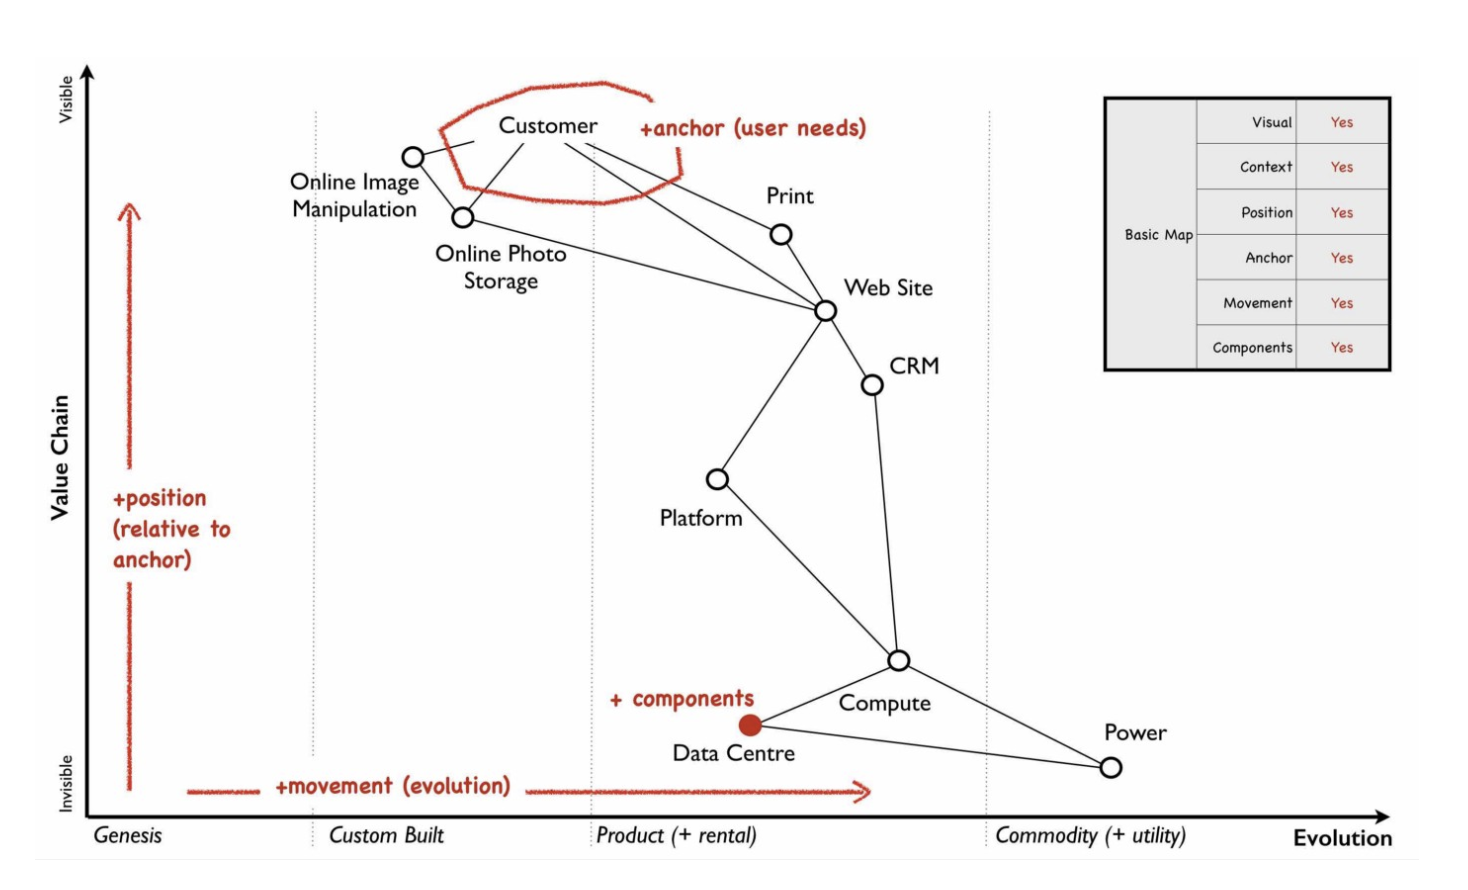
The position of components in the map are shown relative to that Customer on a value chain, represented by the vertical-axis. Each component needs the component below it. The closer to the Customer and the higher up on the vertical-axis, the more visible the component to the Customer. Further down on the vertical-axis, the less visible the component to the customer.
For example, the Customer cares about online photo storage, which requires underlying components like Data Centre and Power, those are further away from the Customer and hence less visible.
The components of the map also have a stage of evolution, the horizontal-axis.
Genesis: This represents the unique, the very rare, the uncertain, the constantly changing and the newly discovered. Our focus is on exploration.
Custom built: This represents the very uncommon and that which we are still learning about. It is individually made and tailored for a specific environment. It is bespoke. It frequently changes. It is an artisan skill. You wouldn’t expect to see two of these that are the same. Our focus is on learning and our craft.
Product (including rental): This represents the increasingly common, the manufactured through a repeatable process, the more defined, the better understood. Change becomes slower here. Whilst there exists differentiation particularly in the early stages there is increasing stability and sameness. You will often see many of the same products. Our focus is on refining and improving.
Commodity (including utility): This represents scale and volume operations of production, the highly standardised, the defined, the fixed, the undifferentiated, the fit for a specific known purpose and repetition, repetition and more repetition. Our focus is on ruthless removal of deviation, on industrialisation, and operational efficiency. With time we become habituated to the act, it is increasingly less visible and we often forget it’s even there.
All the components on the map are moving from left to right driven by supply and demand competition. The components evolve.5
With this basic map structure, we can represent a business context directly (without an intermediate metaphor). Maps are a communication and learning tool through which we can better understand business and strategy.
What Do You Think?
How do you think about strategy? Does your method support learning spatial and temporal patterns? Let me know in the comments.
Next Up
Now that we have a reference frame for business within a business context, we’ll be able to highlight some high-level patterns to be aware of, in Doctrine.
A Non-Euclidean Wardley Map Embedding In Semantic Spacetime
Every Wardley mapper quickly learns the difference between graphs and maps: the space on a map has meaning, whereas space on a graph has none. Another way of framing this is that a Wardley Map is a Euclidean embedding (information is projected onto a Euclidean space, a vertical and horizontal axis). A graph is a non-Euclidean embedding (information content is in the vertices and edges and attributes of the graph).
Euclidean embedding is an excellent interface for people as it is optimized for human visual processing of information. For Wardley Map tool builders, the Euclidean embedding is typically represented in a machine as x and y coordinates. I intend to demonstrate below that a non-Euclidean Wardley Map embedding in a semantic spacetime (a Wardley Graph) seems to be a better machine representation for Wardley Maps tooling.
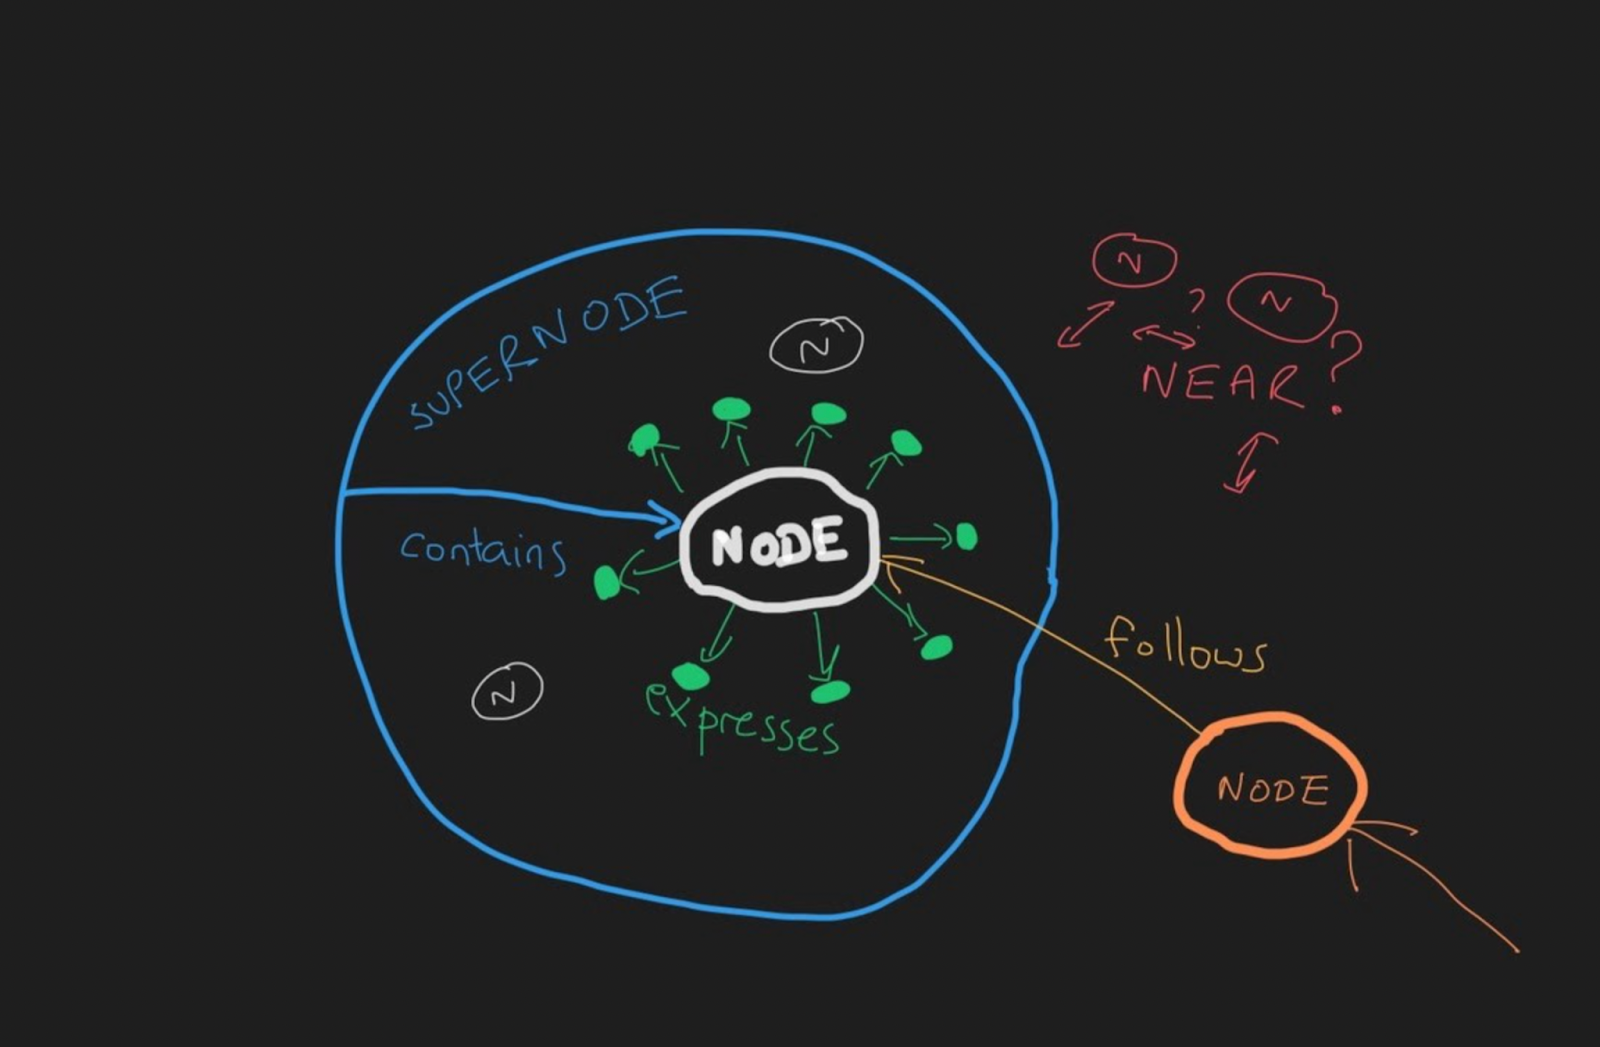
Within semantic spacetime, there exist four meta-types of semantic links, which describe process causal structure. That is, there are, fundamentally, only four kinds of relationships:
CONTAINS (where A contains B) – a container/space-like relationship; to be inside or outside (part of); math analogy is a polar vector
FOLLOWS (where A follows B) – a sequential/time-like relationship; to follow or precede; math analogy is a translation vector
EXPRESSES (where A expresses B) – a local property being expressed; to express information; math analogy is a scalar property
NEAR (where A is near B) – a similarity/nearness relationship; to be next to another location; math analogy is a primitive vector
Each one of the above types can be expressed in four directions:
For specific instances of a link, we would add a specific type to the meta-type. For example: “Is Like” (NEAR), “After” (FOLLOWS), “Depends On” (FOLLOWS), etc.
Examples and intuition regarding specific types1:
With this understanding of semantic spacetime, how do we embed a Wardley Map in it?
The Vertical Axis
The information contained within a Wardley Map vertical axis traditionally represents the value chain. Relative position is the primary information content and is typically modeled by a dependency graph. The semantic link type of the dependencies between components in a value chain is “depends on” (FOLLOWS).
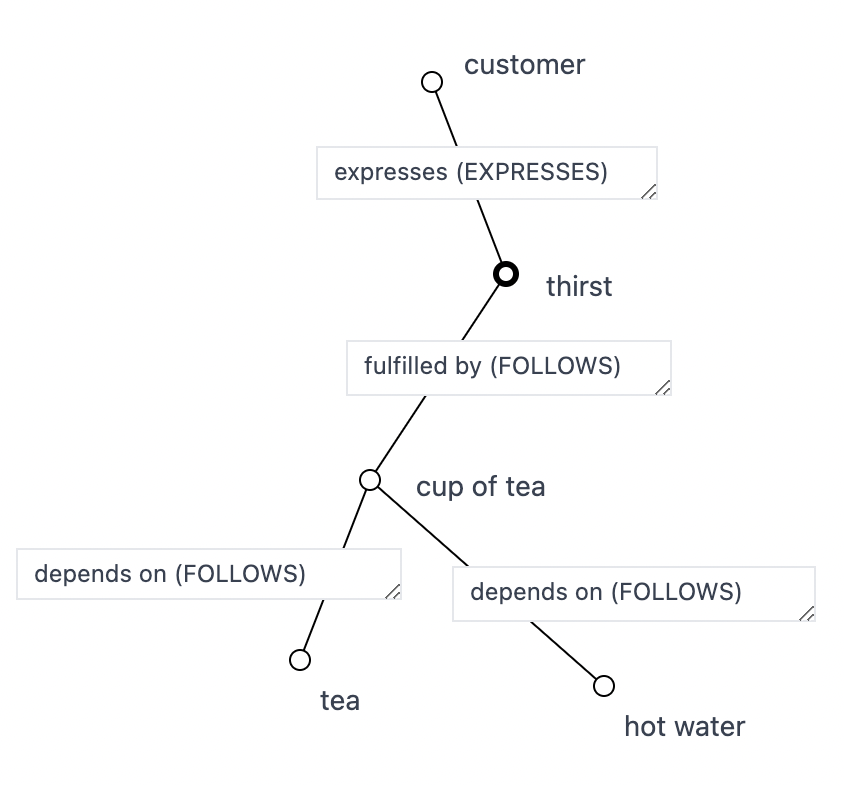
The semantics appear to change near the customer, as the customer expresses a user need (such as “thirst”). The semantic link type of the value chain dependency between a customer and the user need is “expresses” (EXPRESSES).
What then, is the elementary type of link between the user need and the component that fulfills that need? It is another type of FOLLOWS, specifically “fulfilled by” (FOLLOWS).
Visually:
Within the value stream context, it is of note that the customer/user need/offering is only modeled at the edge of the map near the customer anchor (expresses (EXPRESSES) + fulfilled by (FOLLOWS)) and not modeled in the dependency chain of the value stream (all of the “depends on” (FOLLOWS) links). If we consider what needs to happen for the cup of tea component to instantiate, we see that a cup of tea EXPRESSES the need for tea and hot water, and those have to be “fulfilled by” (FOLLOWS) the tea and hot water components.
From this, we can see that a “depends on” (FOLLOWS) link is an aggregate of a component “expressing” (EXPRESSES) a user need which is “fulfilled by” (FOLLOWS) an offering fulfilling the need. That is, if we “zoom in” on a “depends on” (FOLLOWS) link we observe a user need appear surrounded by “expressing” (EXPRESSES) and “fulfilled by” (FOLLOWS) links. For example, “zooming in” into the link between cup of tea and tea:
Again, we typically don’t “zoom in” like this on a map, but my intent here is to demonstrate a certain equivalence present between semantic links in the value chain once they are projected into semantic spacetime.
Just Scaffolding
X : The thing about Wardley's two axes is … Me : I only have one axis – the value chain is actually the chain itself. I wish I had two but the "value chain axis" is simply scaffolding to help beginners map by pointing out a direction for visibility. pic.twitter.com/3yB9rY5G34
Simon Wardley often points out that the vertical position on a Wardley Map is “just scaffolding”. Having seen it now from the semantic spacetime framing, this may be due to all of the information being contained in the graph links, that is, the relative non-Euclidean position with respect to the other nodes. The Wardley Graph directly represents the Wardley Map value chain as nodes and edges.
Horizontal Axis
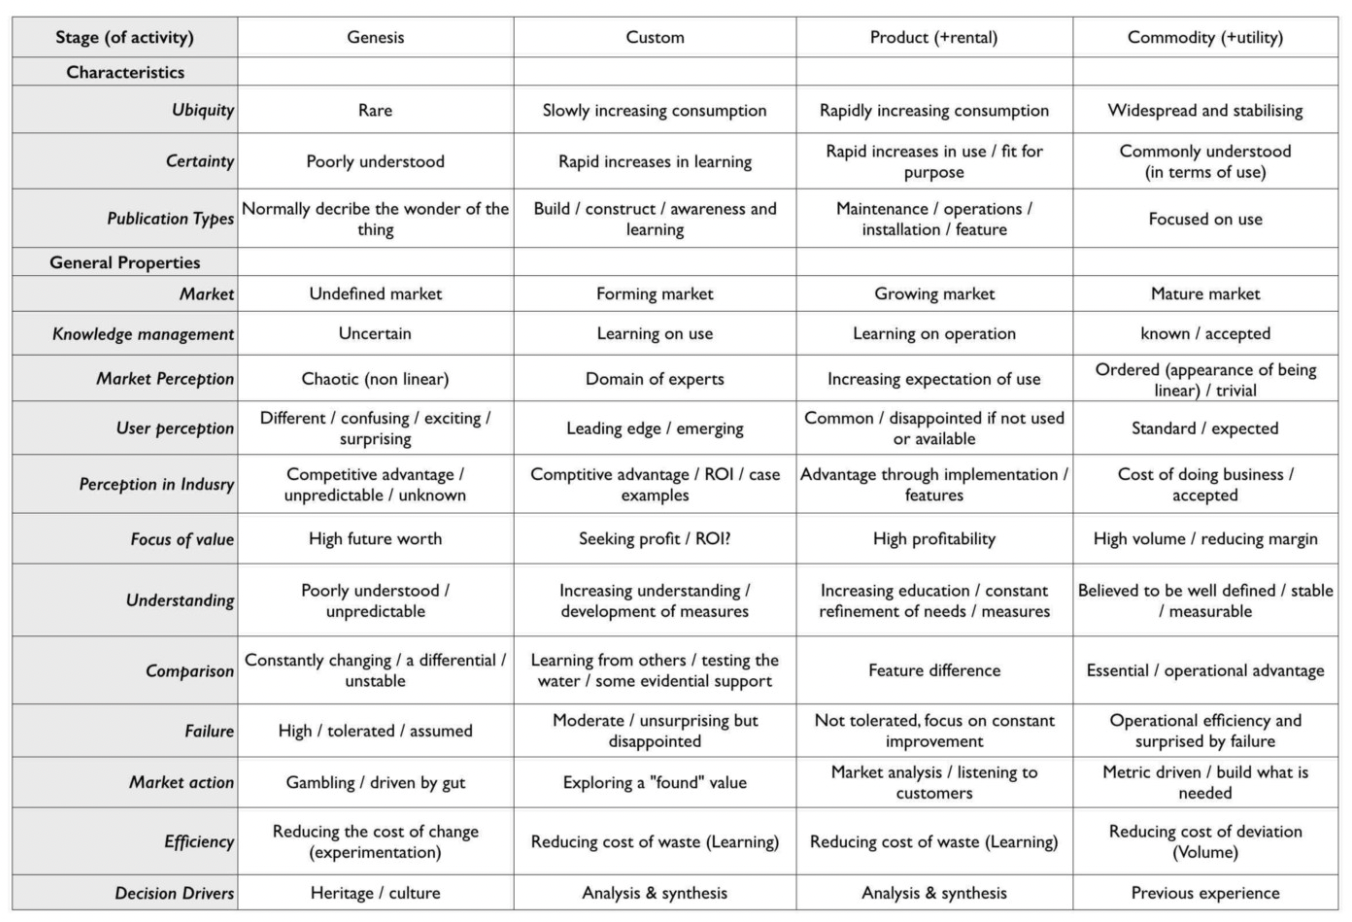
The horizontal-axis of a Wardley Map traditionally maps to the stages of evolution2. In order to determine the horizontal coordinate, the stages of evolution cheat sheet offers qualitative guidance:
For a machine, rather than storing an x coordinate between 0 and 1, it is more effective to retain the specific semantic links to each of the qualitative properties.
I explored machine encoding of the horizontal axis in https://mappingevolution.com, where I collected human (Euclidean projected) input in response to prompts for selecting how NEAR a component under consideration is to each characteristic of each evolutionary stage. This input was then interpreted as a four-dimensional vector with a weight assigned to each stage of evolution. The resultant four-dimensional vector was a summary of an underlying graph of relationships and allowed for aggregation across multiple summaries.
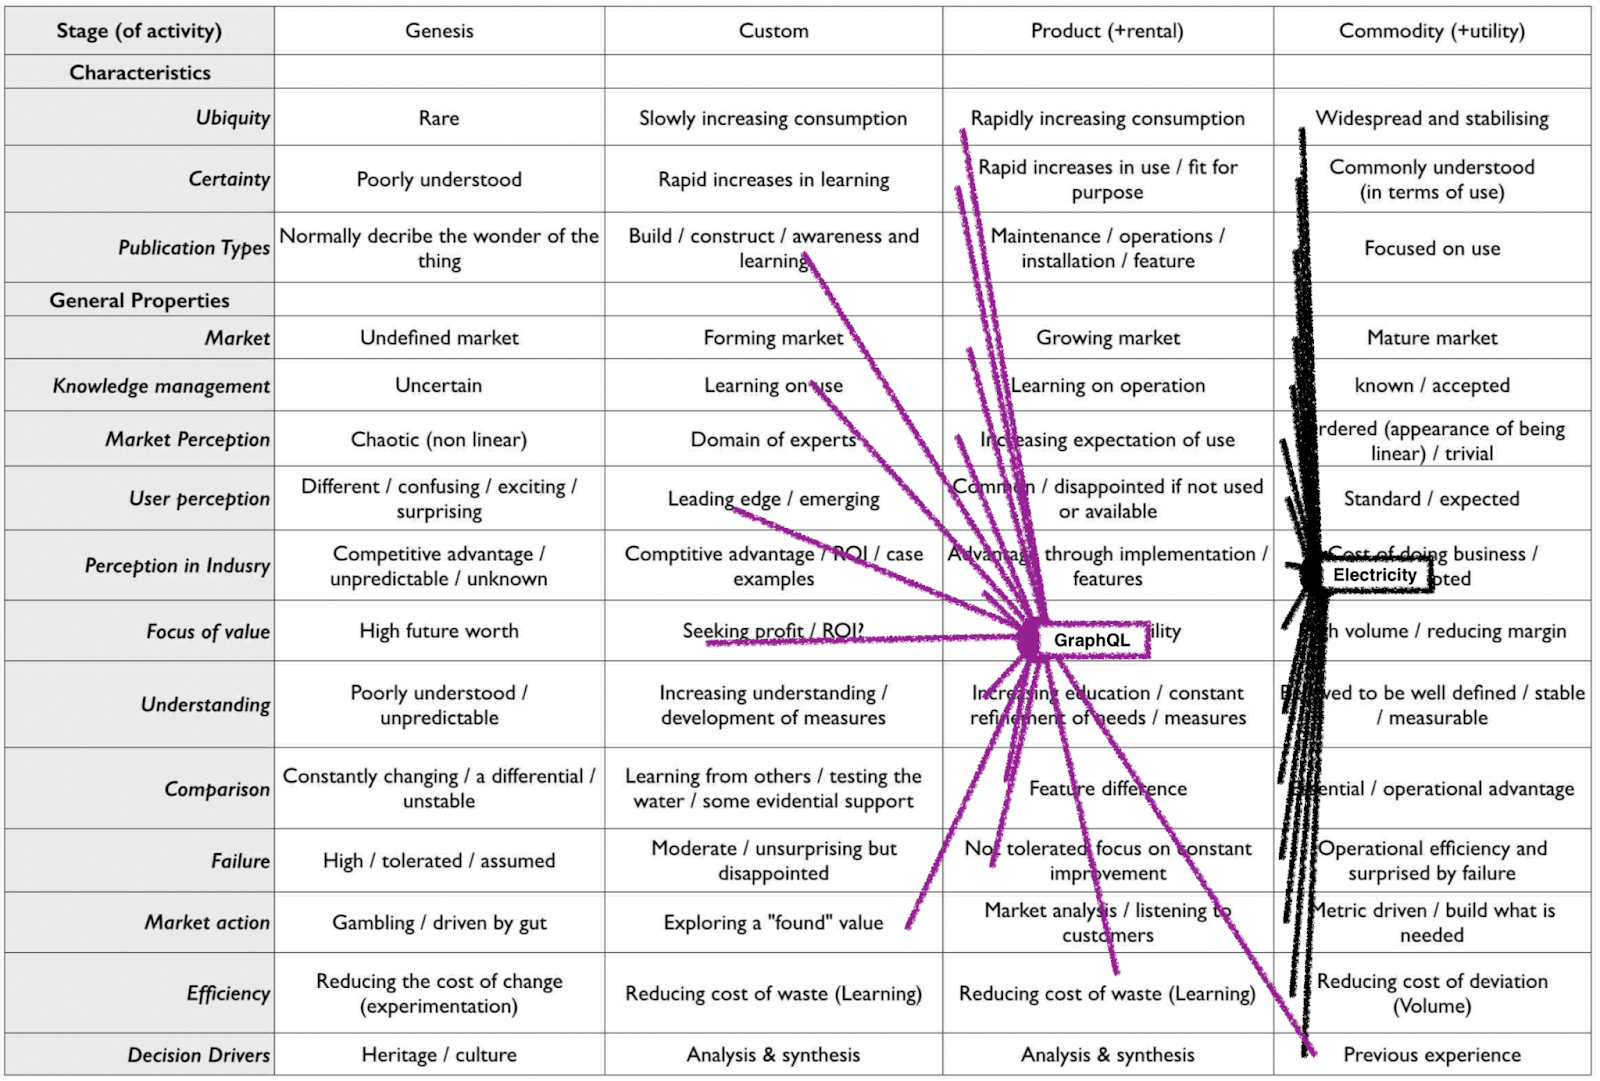
In order to retain the semantic spacetime graph, the approach here is to create a graph between the component and each characteristic in each evolutionary stage using EXPRESSES links. Visually, it looks something like this:
We can retain the meaning of a component being in the Product stage by having most of its links EXPRESS a characteristic that is CONTAINED by the Product stage. Similarly, a component with all links EXPRESSING characteristics CONTAINED by the Commodity stage would correspond to being a Commodity.
This graph representation retains the ability to aggregate multiple summaries by assigning weight to each EXPRESS link based on the count of its occurrences in the individual samples being aggregated.
Additional benefit is that there is no forcing of position in Euclidean space. If an EXPRESS link exists, it contributes to how much Product-ness is being EXPRESSED by the component. If the link does not exist, it has no effect.
This graph representation also enables a graph algorithm for summarizing an entire Wardley Map into a single component (described later).
Characteristics and General Properties Themselves
The characteristics and general properties of the stages of evolution themselves, instead of a table in the illustration above, can also be expressed as a graph. For example, the general property of Failure at each stage: tolerated, disappointed, not tolerated, surprised has bidirectional NEAR links between the stages:
tolerated is NEAR disappointed disappointed is NEAR not tolerated not tolerated is NEAR surprised
Notice that these are not transitive in the sense that Failure being tolerated is not NEAR being surprised by Failure. In general, Genesis is NEAR Custom, which is NEAR Product, which is NEAR Commodity.
Aside from the bidirectional NEAR links, there also exist unidirectional (“evolved from”) FOLLOWS links:
disappointed FOLLOWS tolerated not tolerated FOLLOWS disappointed surprised FOLLOWS not tolerated (and in the case of Obsolescence Climatic Pattern3) not tolerated FOLLOWS surprised disappointed FOLLOWS not tolerated
In general, Genesis is FOLLOWED by Custom, which is FOLLOWED by Product, which is FOLLOWED by Commodity, (and in the case of Obsolescence Climatic Pattern) which is FOLLOWED by Product, which is FOLLOWED by Custom.
In the context of Obsolescence Climatic Pattern, there are interesting differences in characteristics expressed by a component in Custom at the beginning of its existence when compared to being in Custom at the end of its existence.
Recovering the Horizontal Axis
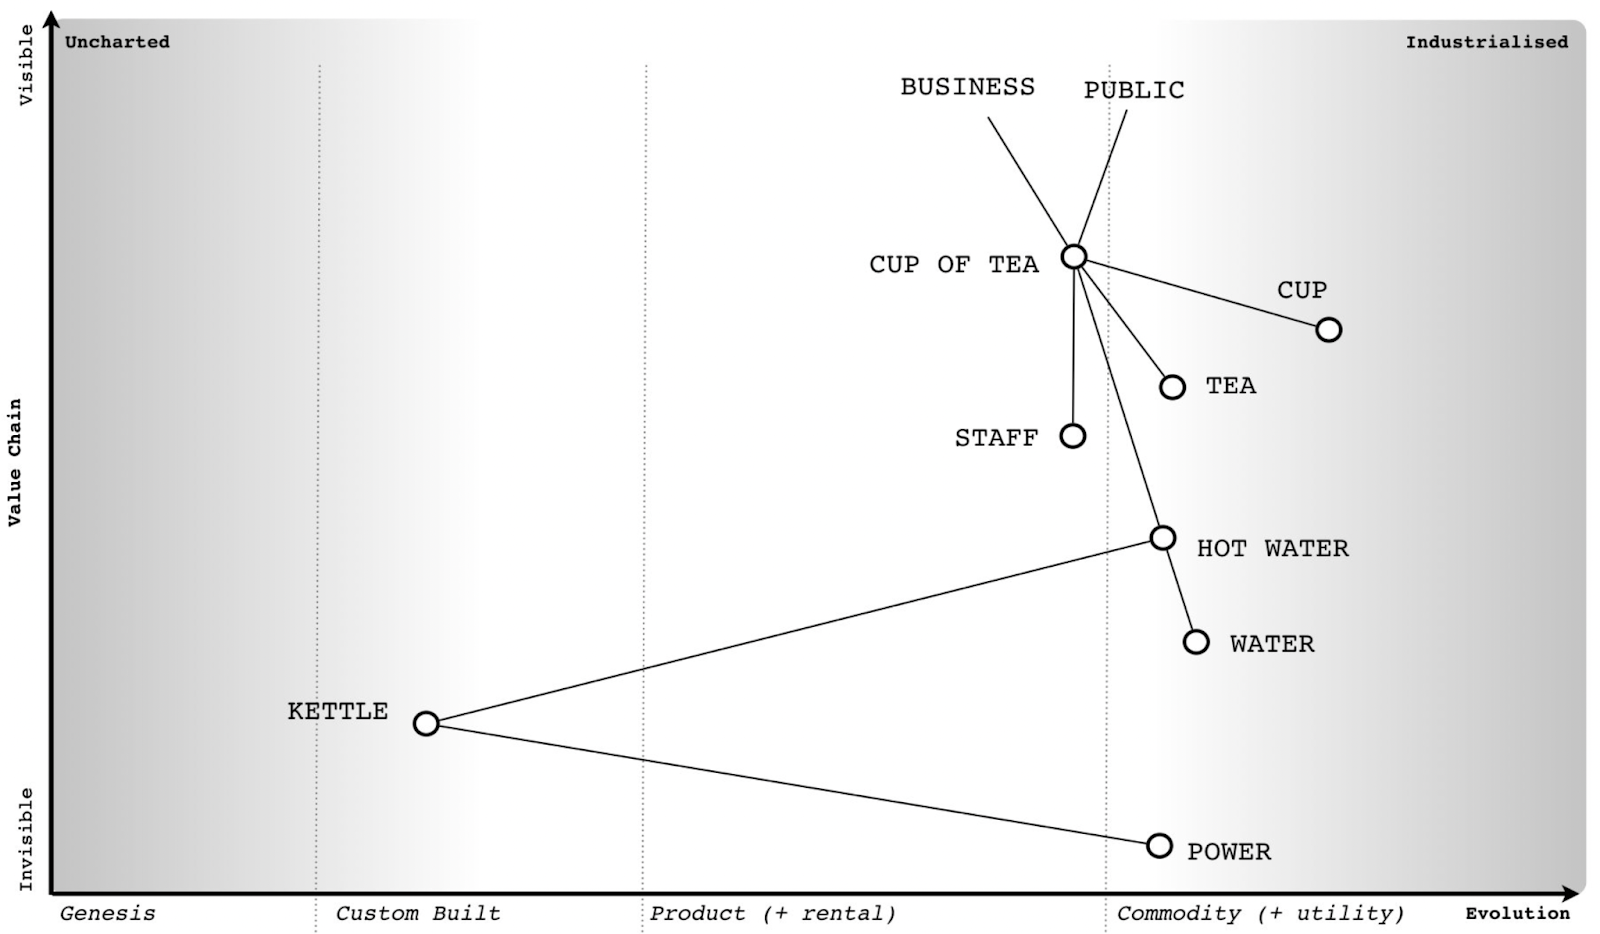
The idea of the Wardley Graph is to maintain a graph machine representation for a Wardley Map. This means we need to be able to recover a Wardley Map from a Wardley Graph. For a demonstration, let’s consider the classic Cup of Tea map:
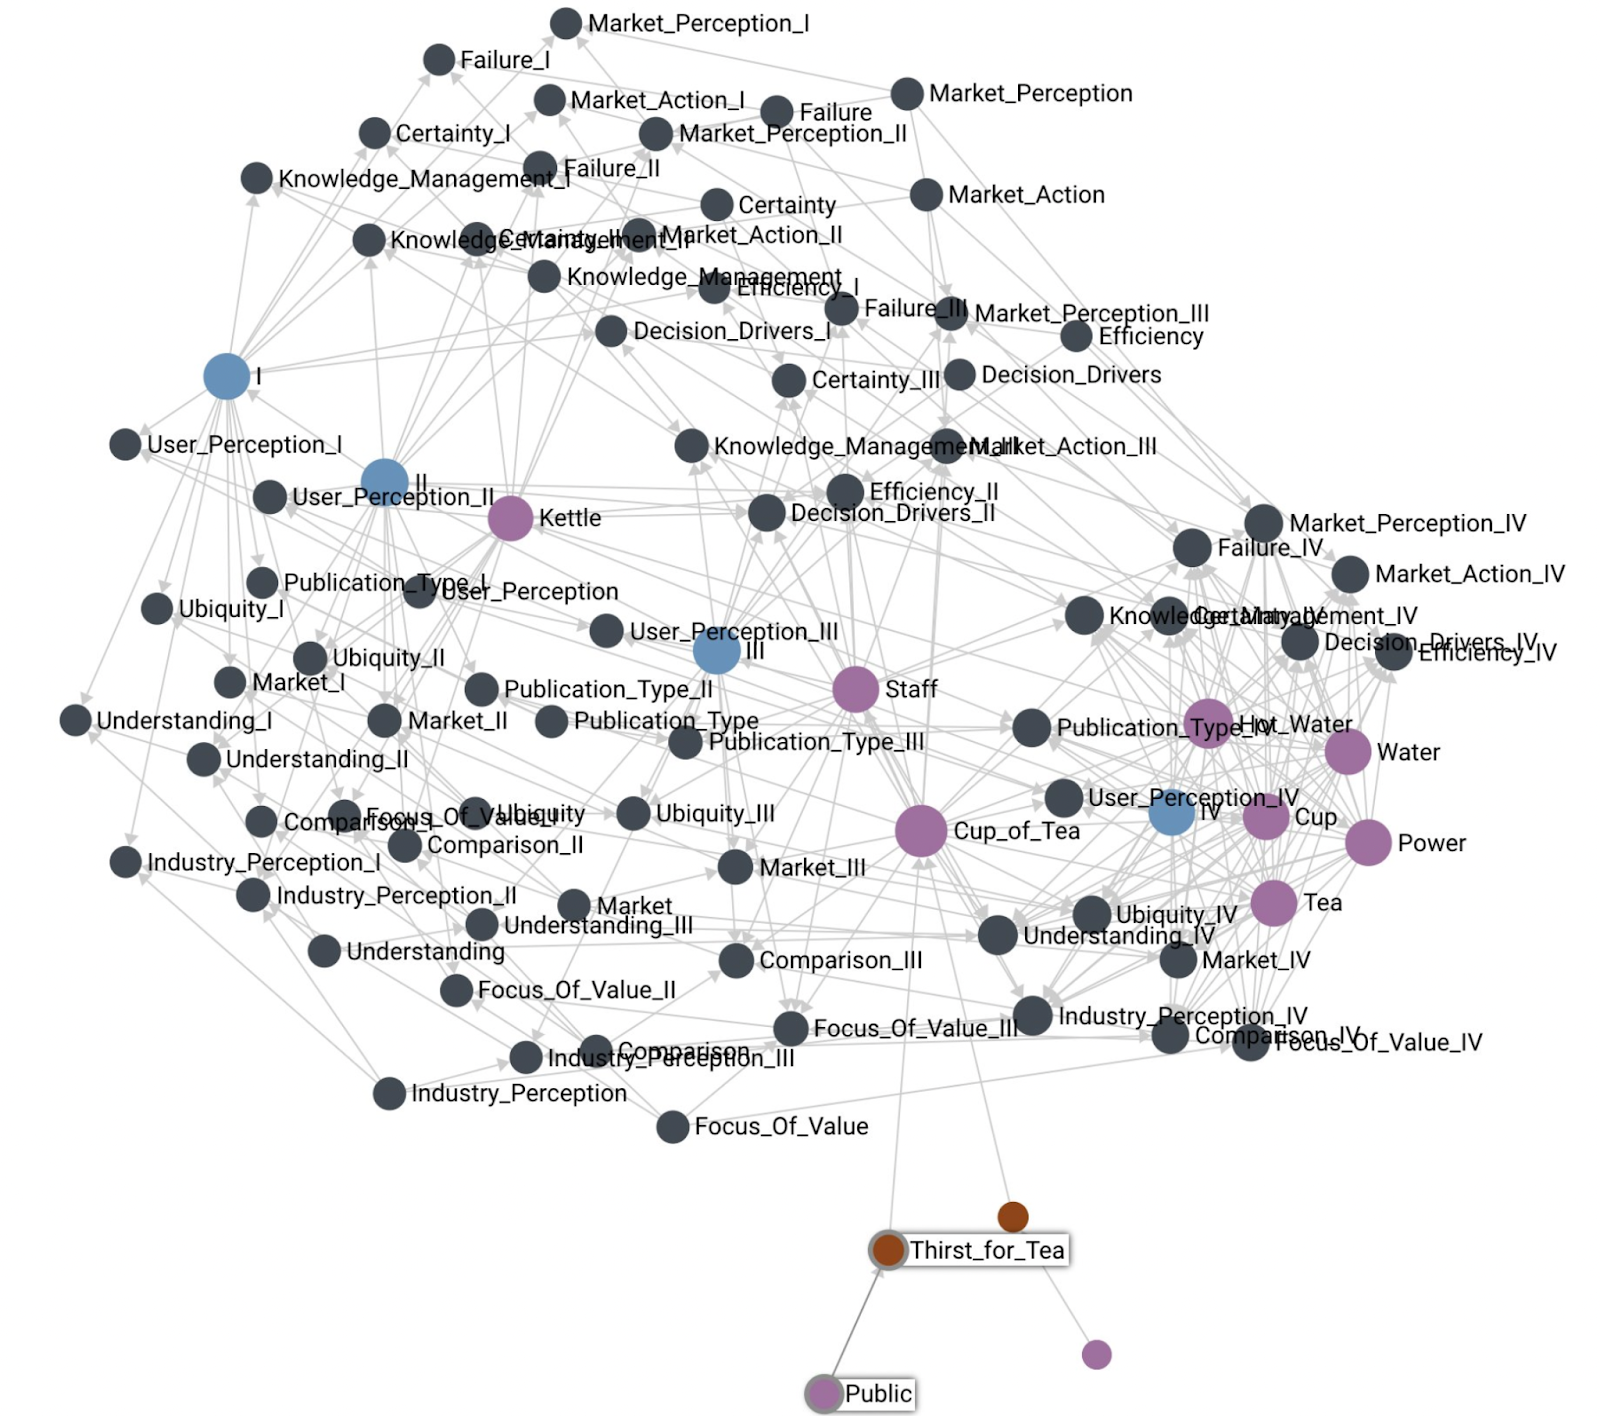
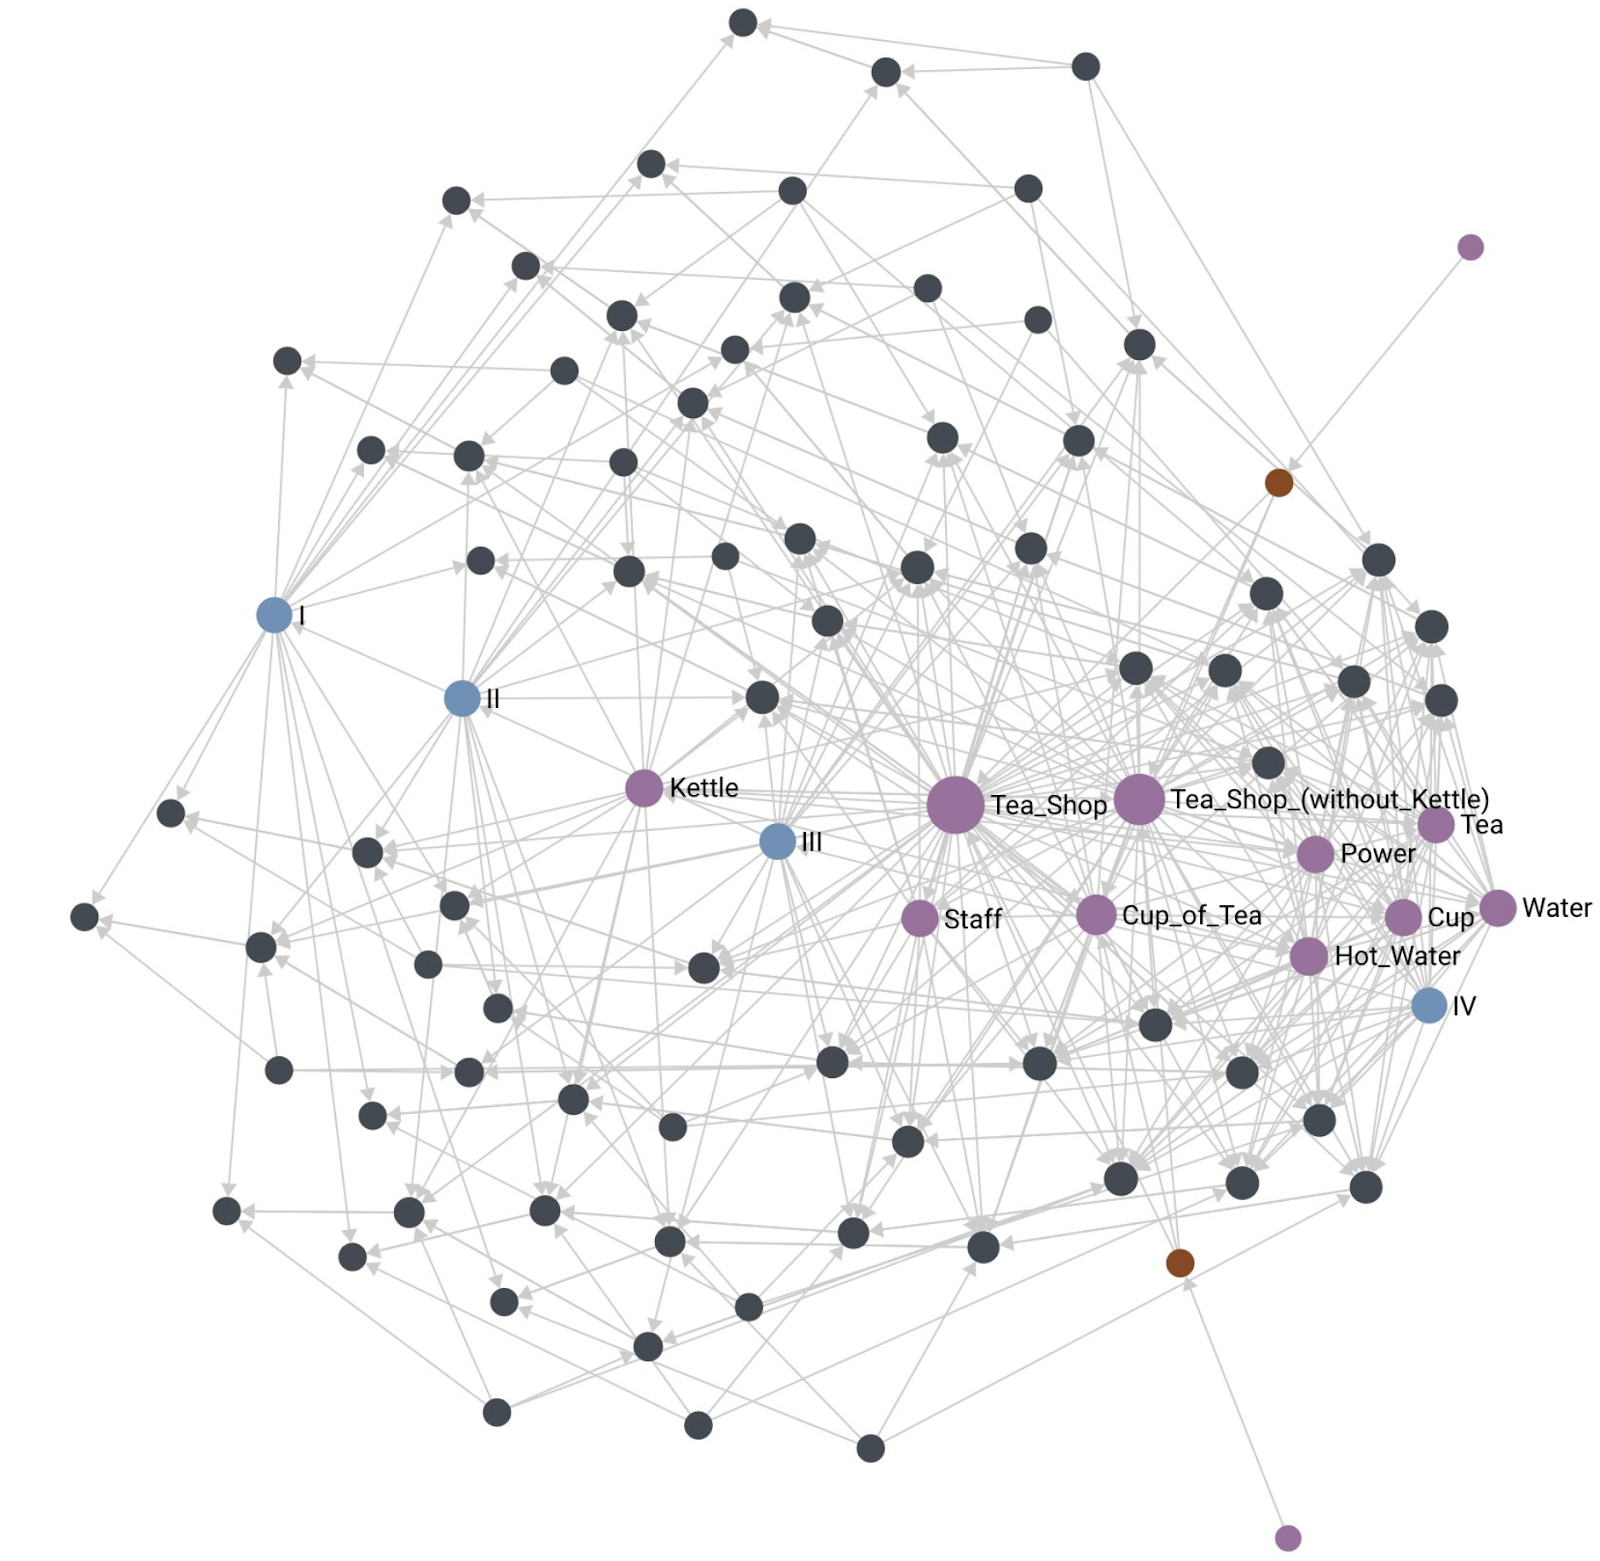
With the Cup of Tea map encoded as a Wardley Graph, we can project it onto Euclidean space, and we see something like this:
First, this is clearly not a Wardley Map. The idea here is to demonstrate that the essential information that we typically extract from the horizontal axis position is present in the graph links. The projection above is done using force-directed graph drawing. Notice the presence of stages of evolution I, II, III, and IV and imagine the horizontal axis aligned along that sequence of nodes. We see that where each component is located ends up corresponding to where it is present on the original Wardley Map. This means that the graph alone contains enough information to reconstruct the horizontal axis coordinate from the graph information alone.
Another thing of note is the location of the customers expressing user needs (Public and Thirst for Tea are highlighted in the picture). I often experience a lot of anxiety of where to place the customer on the evolutionary axis. Within the Wardley Mapping community, there are also methods that depict the customer using different horizontal labels, or even a completely different coordinate system like the user journey. The Wardley Graph encoding can demonstrate that customers and user needs are a boundary condition and do not need to be associated with stages of evolution to be useful.
Movement
Components Move
Throughout the stages of a component’s evolution, the component updates the EXPRESSES links between itself and the various stages of each evolutionary characteristic. The aggregation of these links viewed at different times changes as the component EXPRESSES more characteristics CONTAINED by one stage of evolution vs another (Genesis, Custom, Product, or Commodity). When these snapshots are viewed over time, an effect corresponding to what we label as “movement” occurs.
This same movement occurs on the Wardley Graph:
If you’re having trouble seeing the similarity, consider this visualization showing the same movement as the videos above, but this time on a Wardley Graph with nodes arranged in the familiar grid pattern:
Moving Components
One of the uses of Wardley Maps is to determine what actions to take where on the map. One of those actions may be to accelerate a component along its evolutionary trajectory. In order to move a component in semantic spacetime towards a more desired state of evolution, we can evaluate each characteristic and focus on the component EXPRESSING a different characteristic through our actions in the world. For example, increasing components ubiquity by switching to mass manufacturing methods.
This framing highlights that some characteristics may be actionable/controllable/leading (switch from experimental investment to searching for profit), while others may be unactionable/lagging (user perception, market perception).
Jabe Bloom (@cyetain) points out that “movement is not free”, therefore, affecting component characteristics requires action that expends time and treasure. Chris Daniel (@wardleymaps) points out that some moves are too expensive to make: “toxic legacy”, therefore, some changes in characteristics may be completely out of reach.
Summary/Aggregation
So, we have a Wardley Graph, what is the benefit?
One of the problems that machines need to deal with that humans do automatically is summary and aggregation of components on Wardley Maps. On the Cup of Tea map there is a Power component. This is fairly abstract, but if needed, we could replace the Power component with wall socket, breakers, panels, wires, power stations, etc. In machine representation, we need to be able to do something similar, and this is where Wardley Graph machine representation is really useful.
Instead of saying this is possible in the abstract, we can instead define a graph algorithm for Wardley Map component summary based on Mark Burgess’ algorithm for grouping nodes into supernodes4. The algorithm below is written in terms of summarizing all map components (excluding user needs and customers), but works just the same for summarizing only a subset of map components.
Map components are all marked under a single “hub” component (the summary component for the map). All the map components are linked to the hub with a CONTAINS link, specifically “Is contained by” (CONTAINS).
Aggregate information about each map component is aggregated into the hub component. This information is:
Total count of map components (aggregated from existing counts if map consists of hub components already).
Any other scalar-like property of the nodes, ex: EXPRESS links summed up and tallied
Consider other graph machine learning node features. For example, a Graphlet Degree Vector (GDV) could express the particular way that components express evolutionary characteristics. The specific graphlet count could indicate how many characteristics are expressed by the component.
Links from summarized components to things that are outside of the hub are copied to the hub component. Repeated links are summed and represented as link weight.
For information encoded in the vertical axis (value chain), the hub component does not include user needs and customers, those remain outside of the hub.
For information encoded in the horizontal axis (evolution), all of the component EXPRESS links designating their stage of evolution are aggregated and summed as link weights at the hub level, thus determining the hub’s summary stage of evolution.
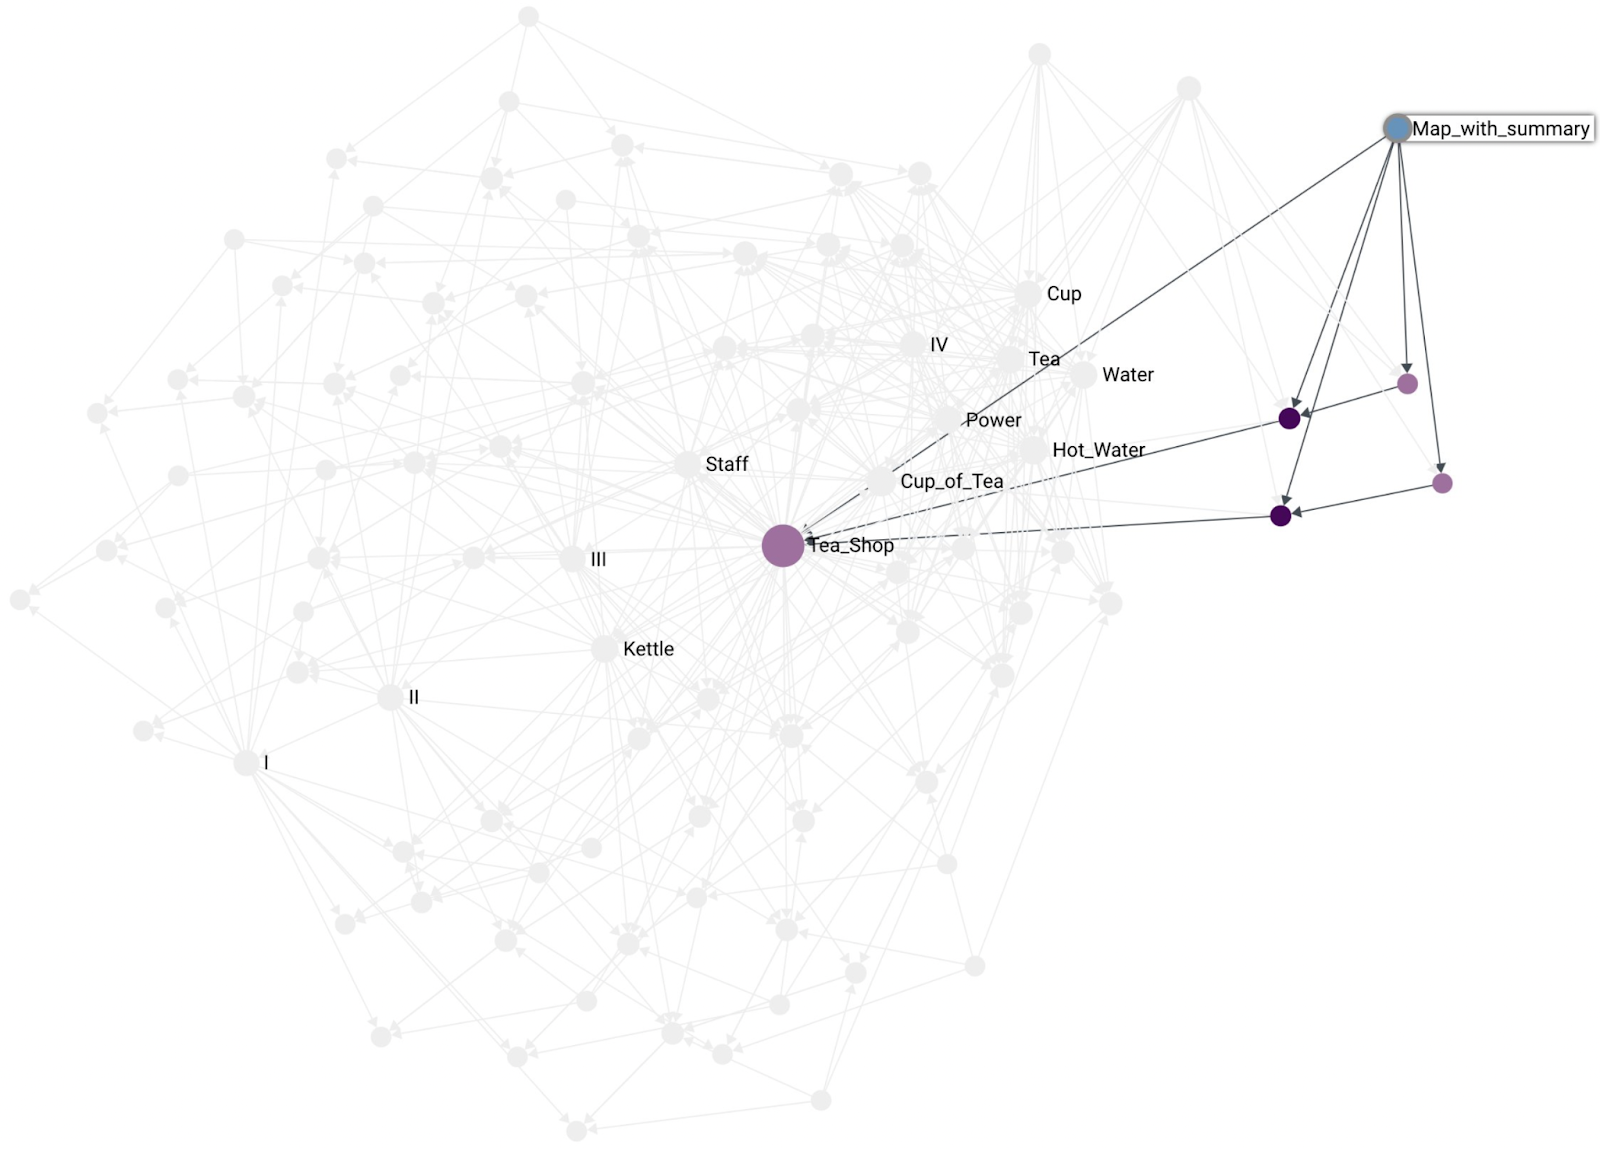
As a result of the above algorithm, the hub becomes a single component, ready to answer queries, and can be used as a component of another map, thus expressing the fractal nature of Wardley Map components. For example, the above algorithm can generate a summary Tea Shop component for the entire Cup of Tea map. Note in the illustration below that the Tea Shop ends up projecting into space where you’d expect it to. Also note that the summary of Tea Shop (without Kettle) is also where you’d expect it to be.
With the Tea Shop, we have an example of summarizing many components into a single summary component. Another use for the summary algorithm is to integrate multiple points of view of the same component, a version of crowdsourcing. Multiple people (and machines) can determine characteristics expressed by some component. The summary algorithm can then integrate all those points of view and provide a crowdsourced version of the component. This is another powerful collaboration feature enabled by the Wardley Graph.
Another benefit of automated summary are component updates. When a constituent component is updated, the summary and anything else connected can be updated automatically as well.
What is a Map?
How should maps be represented on the Wardley Graph?
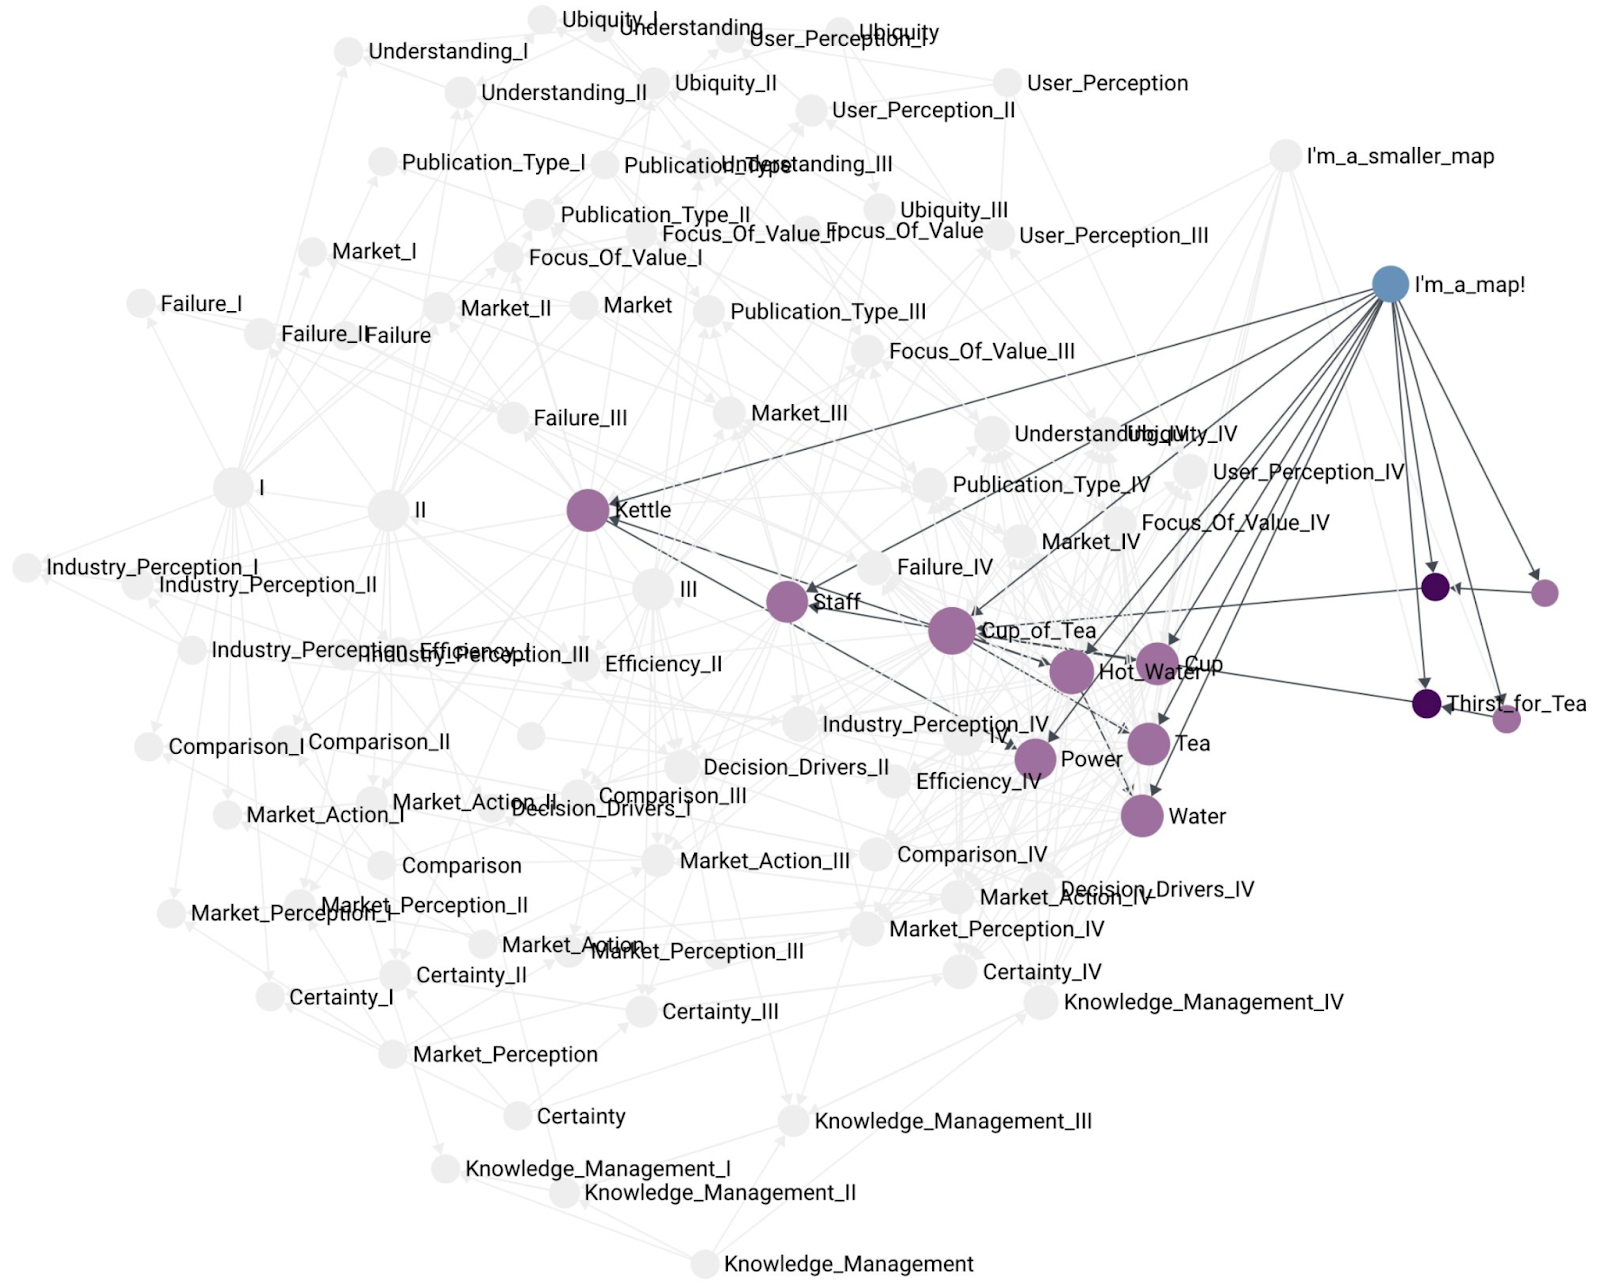
I think it is worth making the distinction between a map and a component that summarizes other components. That is, a map is not a summary component. A map does not contain other maps. A map simply contains the components, customers, and user needs that are depicted on the map:
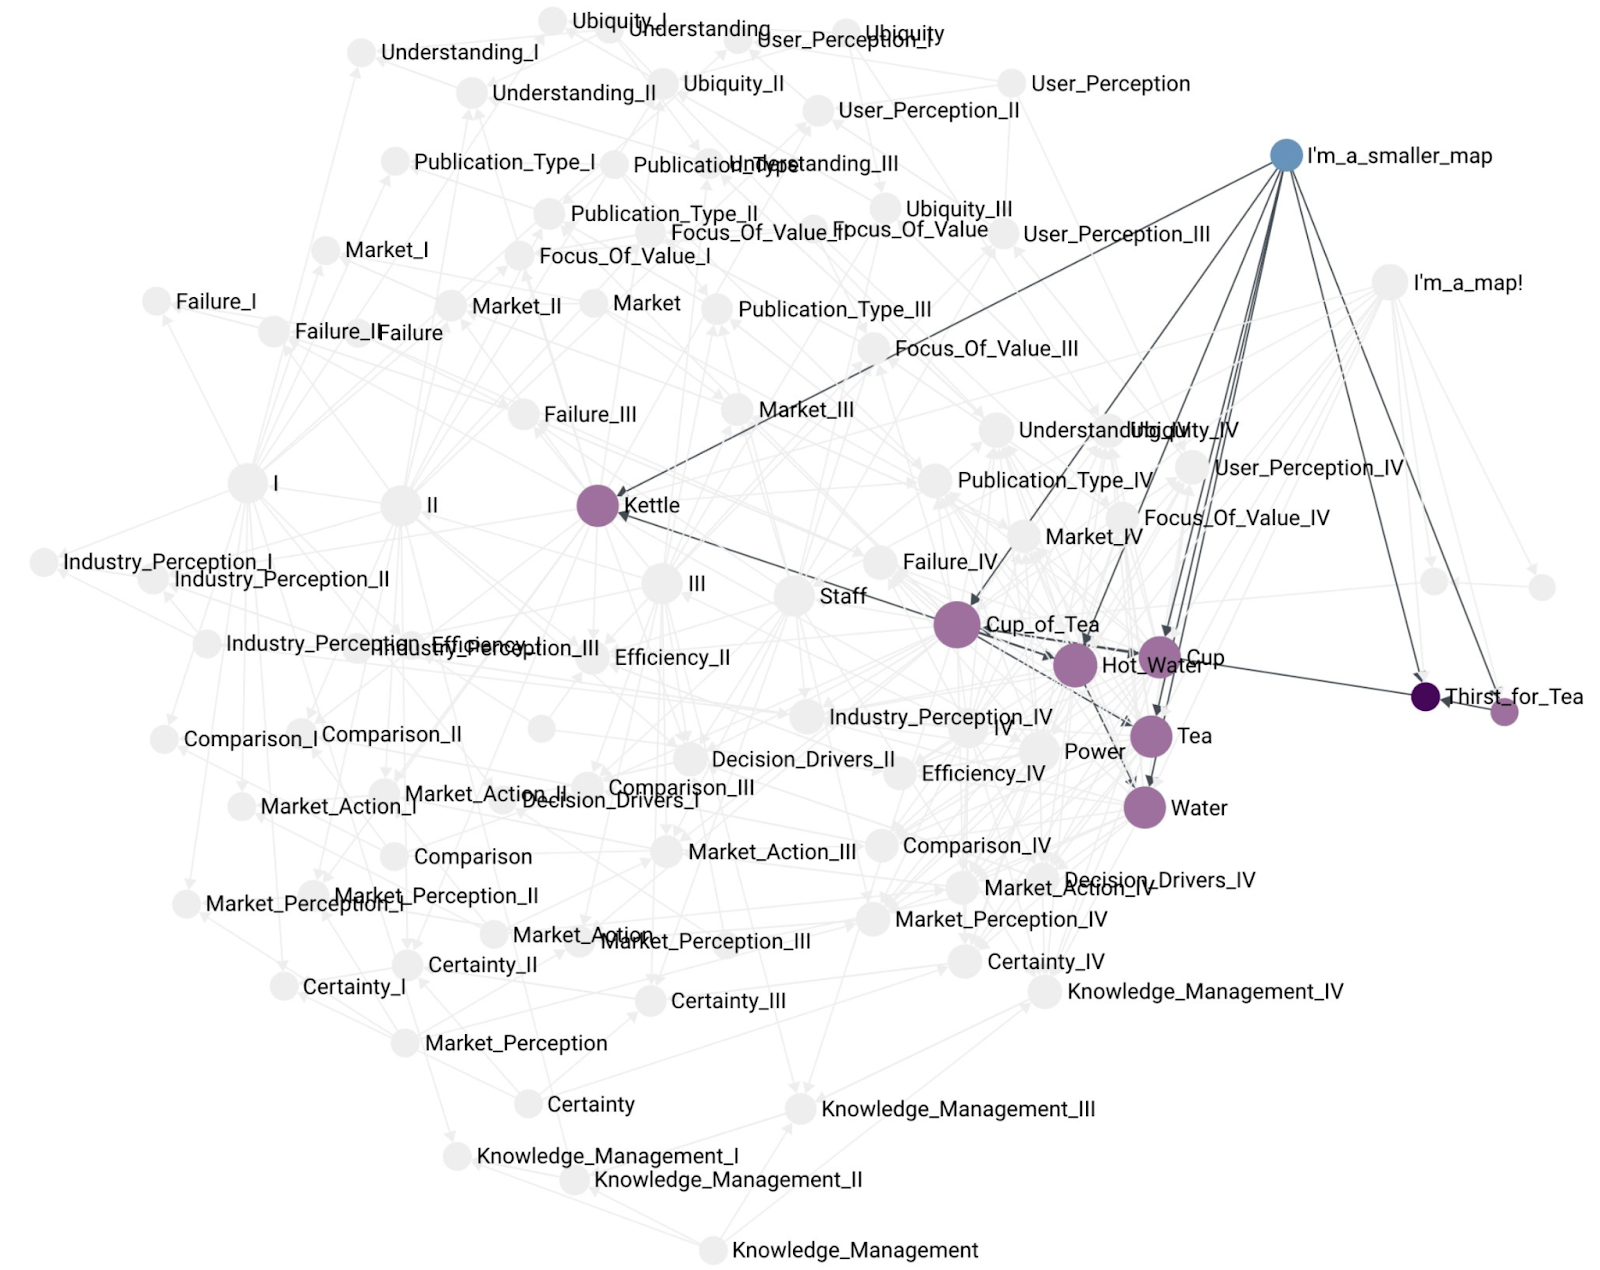
Another, example of a smaller map containing fewer components:
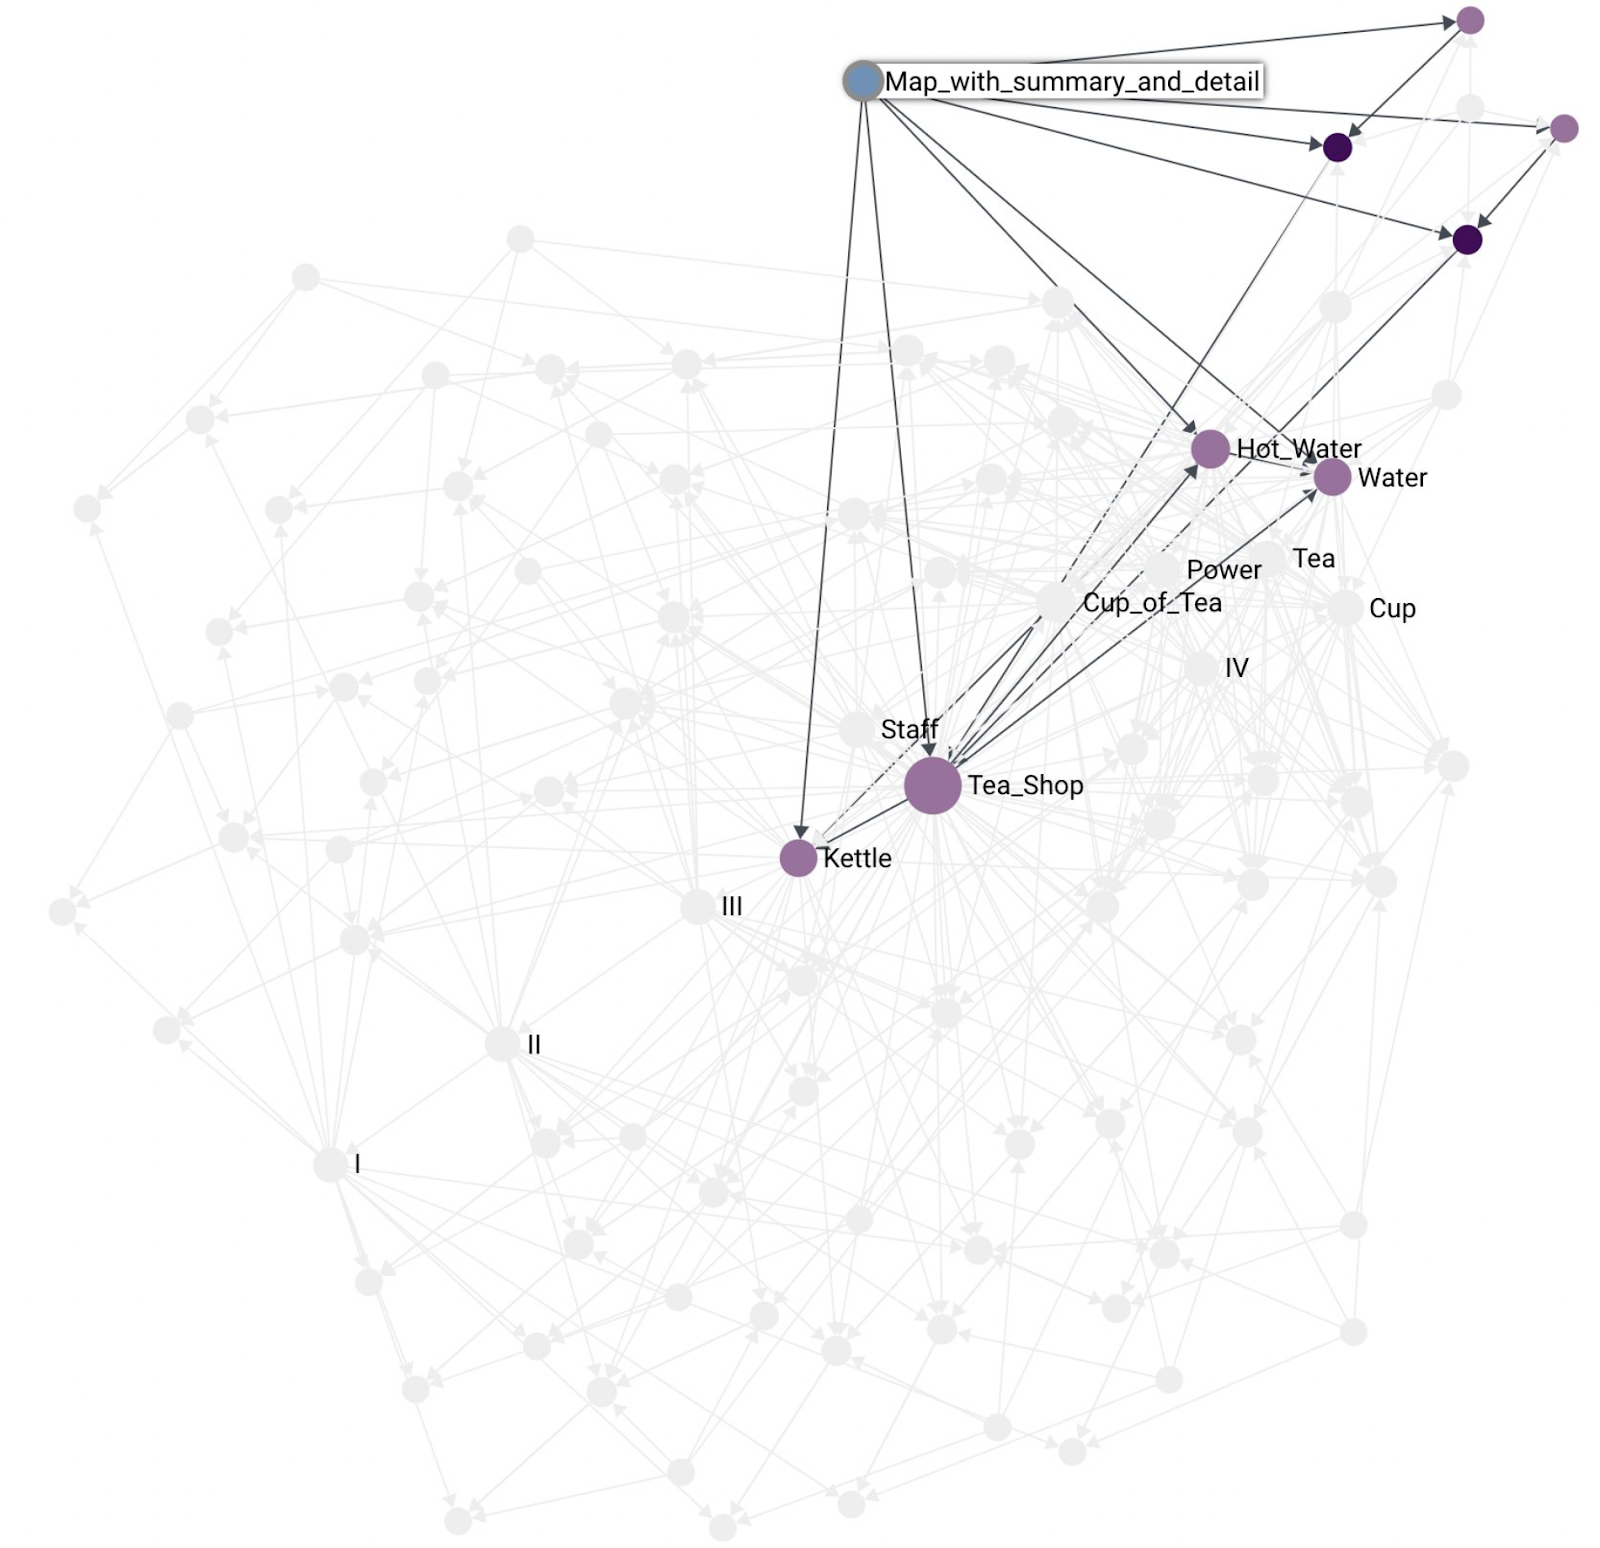
As mentioned before, a map is not the same as a summary component. Here is an example of a map that contains the Tea Shop summary component as part of the map:
With maps and components being distinct from each other we end up with a representation where maps can have both, the summary component and at the same time highlight some of that component’s constituents. For example, the kettle situation in the Tea Shop:
What’s Next?
The above is what I’ve been able to put together so far in my exploration of embedding Wardley Maps in non-Euclidean semantic spacetime. I hope you enjoyed the journey and see Wardley Maps from a new perspective. I very much recognize the irony of promoting a graph to represent a map, but I hope I made the context clear for when to use a graph (machine representation) and when to use a map (human interface).
As a tool builder, I find this graph representation very compelling and sympathetic to the problems I encountered when attempting to create a useful machine representation. I hope that by sharing it with you we can improve the capabilities of our tools and perhaps this could become a useful common foundation for a common interface/representation between our various systems.
For the Wardley Graph implementation itself, my experimental library is https://github.com/tristanls/wardleygraph, where you can see semantic spacetime concepts adapted specifically for the Wardley Graph use case. Additionally, that’s where you’ll find reference implementation of the summary algorithm and examples of how to encode the information contained in a Wardley Map into a graph.
There is plenty more to do and learn. Graph machine learning comes to mind. What would scenario planning look like on a Wardley Graph? Can I subscribe to components maintained by experts? Does a graph make it easier? The current implementation uses ArangoDB as the graph database, I intend to explore using Amazon Neptune next. I hope you find the graph representation as compelling as I do, and I look forward to seeing what the Wardley Mapping community can do with it.
1 Burgess, Mark. Smart Spacetime: How information challenges our ideas about space, time, and process (Kindle Location 6668). Kindle Edition.
In a 1913 essay “Some Fundamental Legal Conceptions as Applied in Judicial Reasoning”, Wesley Newcomb Hohfeld outlined what seems very much like a Promise Theoretic approach to judicial reasoning regarding interest in property.
Hohfeld distinguishes the jural concepts of Right, Duty, Privilege, No-Right, Power, Liability, Disability, and Immunity.
As depicted, there exist promise-like relationships between these concepts. Hohfeld highlights jural correlatives: Right and Duty, No-Right and Privilege, Power and Liability, Disability and Immunity. Hohfeld also highlights jural opposites: Right and No-Right, Duty and Privilege, Power and Disability, and Liability and Immunity.
If A has a Right against B to exclude B from using A’s property, then B has a Duty to not use A’s property. This is an example of what is usually meant by property. Through the Promise Theory lens, A promising the exclusion of B (Right) works only if B promises to be excluded (Duty). Additionally, A may also wield the Power to change or create a legal relationship regarding the property. A’s Power is correlated with B’s Liability to the changes created by A. Through the Promise Theory lens, A promising transfer of ownership (Power) only works if B promises to recognize the transfer (Liability).
NFTs seem to claim Right and Power without having the corresponding Duties and Liabilities in place. The NFT industry certainly wishes that the Duties and Liabilities were in place. But, that is not the case today. An NFT is advertised as property, and an NFT purchaser feels like they are buying the Right to exclude others from their property. The problem arises that everyone else has no Duty to be excluded. In the Promise Theory sense, an NFT purchaser promises the exclusion of others (Right), but everyone else does not promise to be excluded (Duty). Additionally, an NFT purchaser believes they assume Power to create legal relationships regarding their purchase. However, everyone else does not have the Liability to be subject to those legal relationships. In the Promise Theory sense, an NFT purchaser promises transfer of ownership (Power), but everyone else does not promise to recognize the transfer (Liability).
I’ll end by highlighting that it seems to me the NFT situation is much worse for NFTs. Not only does everyone not have the Duty and Liability regarding NFTs Right and Power, it also seems to me that everyone has Privilege and Immunity from that Right and Power via all the property mechanisms preceding NFTs.
There are at least two kinds of games: finite and infinite. A finite game is played for the purpose of winning, an infinite game for the purpose of continuing the play. Finite games are those instrumental activities – from sports to politics to wars – in which the participants obey rules, recognize boundaries and announce winners and losers. The infinite game – there is only one – includes any authentic interaction, from touching to culture, that changes rules, plays with boundaries and exists solely for the purpose of continuing the game. A finite player seeks power; the infinite one displays self-sufficient strength. Finite games are theatrical, necessitating an audience; infinite ones are dramatic, involving participants…
I no longer recall where I first came across finite and infinite games. I’m pretty sure I did not read the book. I’m not sure the concept needs a book. The introduction of the concept of infinite game, where the purpose is to continue to play until one no longer can, reminds me of the Complex domain. In the Complex domain, constraints change due to agent actions, enabling new actions, changing constraints, enabling new actions, and so on…
Sports Metaphor
The framing of finite and infinite games points out that the use of a sports metaphor in business is inappropriate. The purpose of a business is not to win. The purpose of a business is to continue to play. For someone looking at business through a sports lens, they’re playing the wrong game.
Military Metaphor
A military metaphor for business is better than a sports one. Despite Carse somehow classifying military conflict into a finite game, it is anything but. The purpose of the military is not to win a war. The end of hostilities is but a step in setting conditions for the peace that hopefully follows (that’s the reason why wars have rules).
Having said that, I am not a fan of using the military metaphor for business. As I pointed out in Metaphors We Live By, we ought to be sensitive to everything that the metaphor brings along with it. Military deals with death and killing. Typical business stakes are not that high. I will happily trade a “war room” and “fog of war” for an “operations center” and “uncertainty”.
What Do You Think?
Did you notice some metaphors that didn’t seem to fit in a particular context? Did the finite/infinite game distinction clarify why that is the case? Let me know in the comments.
Next Up
Without sports or military metaphors what should we use? I did not have a great answer for this until I came across Wardley Maps, a reference frame for business that originated within business context: Wardley Mapping.
Metaphor is “a figure of speech in which a word or phrase is applied to an object or action to which it is not literally applicable.”1 George Lakoff and Mark Johnsen in their 2003 book “Metaphors We Live By” propose that human thought processes are largely metaphorical. Once I was exposed to this concept, I could not unsee it. I paraphrase and quote liberally below.
Argument Is War
Your claims are indefensible. They attacked every weak point in my argument. Their criticisms were right on target. I demolished their argument. I’ve never won an argument with them. You disagree? Okay, shoot! If you use that strategy, they’ll wipe you out. They shot down all of my arguments.
Time Is Money
You’re wasting my time. This gadget will save you hours. I don’t have the time to give you. How do you spend your time these days? That flat tire costs me an hour. I’ve invested a lot of time in them. I don’t have enough time to spare for that. You’re running out of time. You need to budget your time. Put aside some time for ping pong. Is that worth your while? Do you have much time left? They’re living on borrowed time. You don’t use your time profitably. I lost a lot of time when I got sick. Thank you for your time.
When we use the war metaphor to talk about arguments, when we use the money metaphor to talk about time, it is intended to highlight specific abstract concepts and anchor them in something more real, more grounded. That is the benefit of metaphor. However, along with the concepts we want to highlight, the metaphor brings along with it all the other aspects of the metaphor into our communication, whether we intend it or not. Those aspects may or may not be true. The metaphor may not apply where we don’t intend it to.
Words Matter More Than You Think
Lakoff and Johnsen ultimately point out that all of our language grounds out in our human embodiment.
HAPPY IS UP, SAD IS DOWN I’m feeling up. That boosted my spirits. My spirits rose. You’re in high spirits. Thinking about them always gives me a lift. I’m feeling down. I’m depressed. They’re really low these days. I fell into a depression. My spirits sank. The physical basis is a person’s posture droops along with sadness and depression, whereas an erect posture goes with a positive emotional state.
CONSCIOUS IS UP, UNCONSCIOUS IS DOWN Get up. Wake up. I’m up already. They rise early in the morning. They fell asleep. They dropped off to sleep. They’re under hypnosis. They sank into a coma. The physical basis is humans sleep lying down and stand up when awake.
HEALTH AND LIFE ARE UP, SICKNESS AND DEATH ARE DOWN They’re at the peak of health. Lazarus rose from the dead. They’re in top shape. As to their health, they’re way up there. They fell ill. They’re sinking fast. They came down with the flu. Their health is declining. They dropped dead. The physical basis is being ill forces us to lie down and being dead forces us down.
So, this is all a neat trick, and perhaps mind blowing. The reason I want to share this and bring it to your attention is so that you can recognize the metaphor in your choice of words. Because once you see your metaphor, you may become capable of choosing a different one.
Imagine a culture where an argument is viewed as a dance, the participants are seen as performers, and the goal is to perform in a balanced and aesthetically pleasing way. In such a culture, people would view arguments differently, experience them differently, carry them out differently, and talk about them differently. But we would probably not view them as arguing at all: they would simply be doing something different. It would seem strange even to call what they were doing “arguing.” Perhaps the most neutral way of describing this difference between their culture and ours would be to say that we have a discourse form structured in terms of battle and they have one structured in terms of dance.
Some rhetorical questions to consider: Are you really fighting a fire when something bad happens at work? Are you really fighting a war when you’re in a war room? How much baggage are you bringing along with one convenient phrase? Do you want to feel at risk of death because a website is down and a computer can’t respond to a request? Is the metaphor worth it?
What Do You Think?
Since I read “Metaphors We Live By”, I cannot stop seeing the metaphor everywhere. Do you see it? Do you use some unusual metaphors purposefully? How would you describe “happy” without embodied metaphor? Is it even possible? Let me know in the comments.
The website above is a great reference and goes into a lot… A LOT… more detail than I will go into here. I want to focus on a particular aspect of how complex systems fail that I find particularly useful in the context of Onboarding to a Software Team.
Clear/Chaotic Boundary
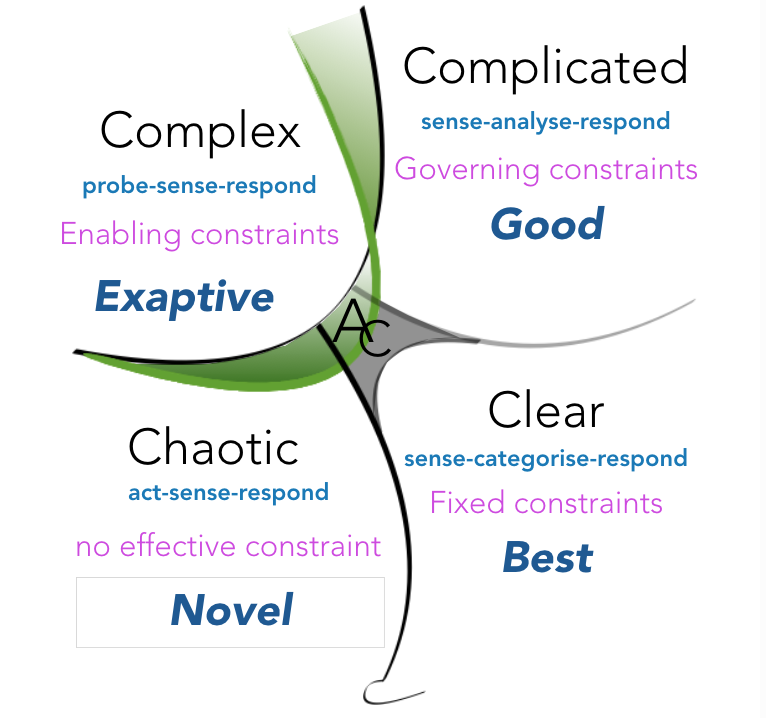
I highlighted variousaspects of the Cynefin framework in this series so far. I want to return to it once again and discuss the boundary between the Clear and Chaotic domains. Notice, in the figure below, that the boundary is drawn with a squiggle on the bottom. This is intentional, in that it intends to be a visual representation of a cliff between Clear and Chaotic. Transition from Clear to Chaotic is a one way transition without a direct return path. Why would Clear become Chaotic?
In the framing of Economy of Thought, I pointed out that while the world is complex, it is expensive to treat everything as such and I can choose to summarize some of the complexity as Clear.
It ain’t what you don’t know that gets you into trouble. It’s what you know for sure that just ain’t so.
The problem occurs when I treat something as Clear and it turns out not to be the case.
Rasmussen’s Model
So, what happens that shifts a Clear system into the Chaotic domain? It’s not like it’s waiting for me to turn around and then beelines straight for the cliff into Chaos screaming “YOLOOOOOO!…” on the way down.
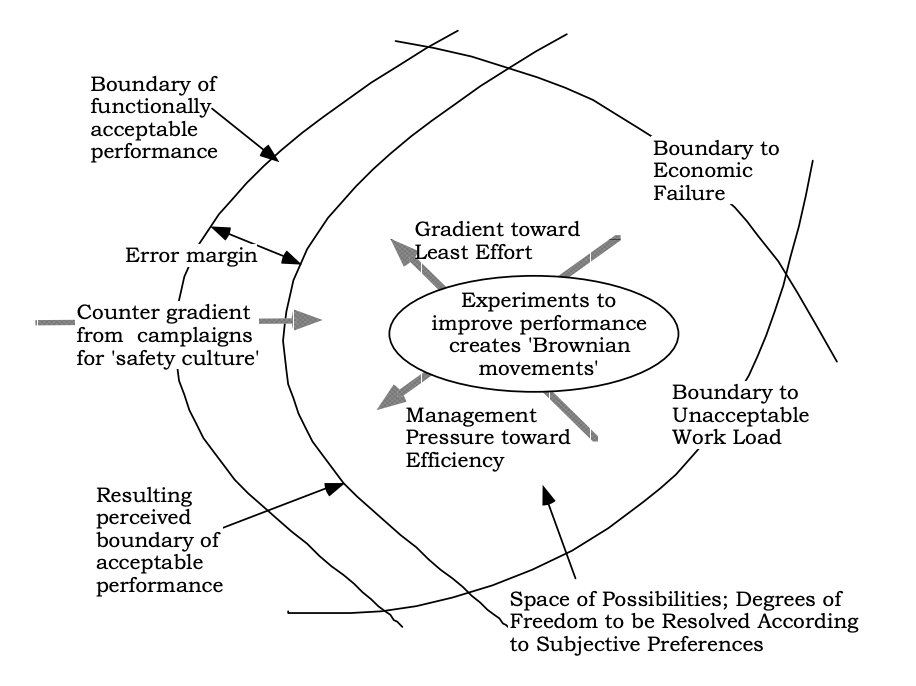
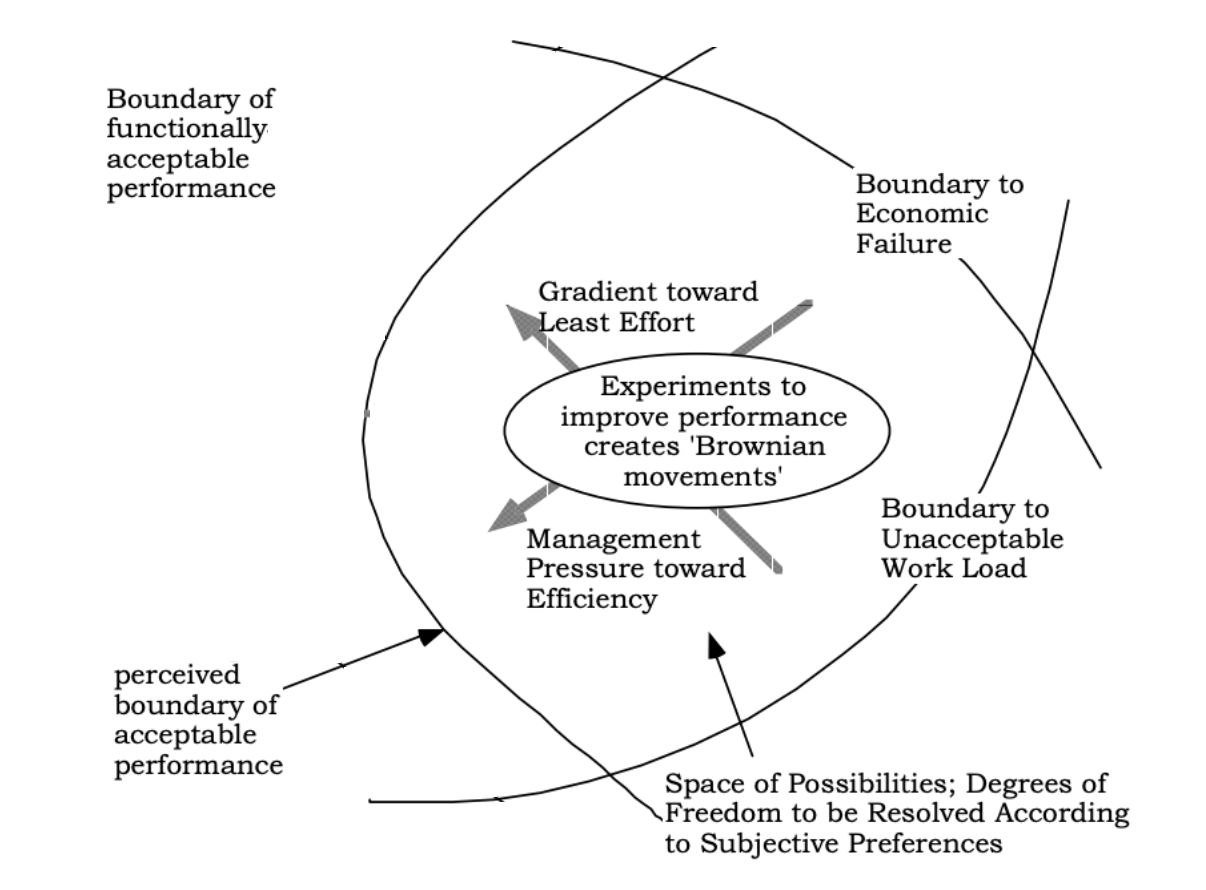
Jens Rasmussen came up with a model that I think captures the intuition behind what is happening.
Rasmussen, Jens (1997). “Risk management in a dynamic society: A modelling problem”. Safety Science, 27(2-3), 183-213. https://doi.org/10.1016/S0925-7535(97)00052-0. Accessed on 21 Mar 2021.
This is a busy figure. Take note of the boundaries on the right hand side. There is a Boundary to Economic Failure; if the system moves beyond there, you go bankrupt. There is a Boundary to Unacceptable Work Load; if the system moves beyond there, everyone is spents and work stops. As a result of these boundaries, there exists a pressure “from management” toward efficiency which applies a force to the left, away from the Boundary to Economic Failure. Additionally, there is a gradient towards ease of work, which applies a force to the left, away from the Boundary to Unacceptable Work Load. Together, these forces create a movement in the system toward the third boundary on the left-hand side, the Boundary of functionally acceptable performance, i.e. failure.
So, it seems rather straightforward, we should simply not let the system drift beyond the failure boundary. Well, there are a few constraints that make this difficult.
Normalization of Deviance1
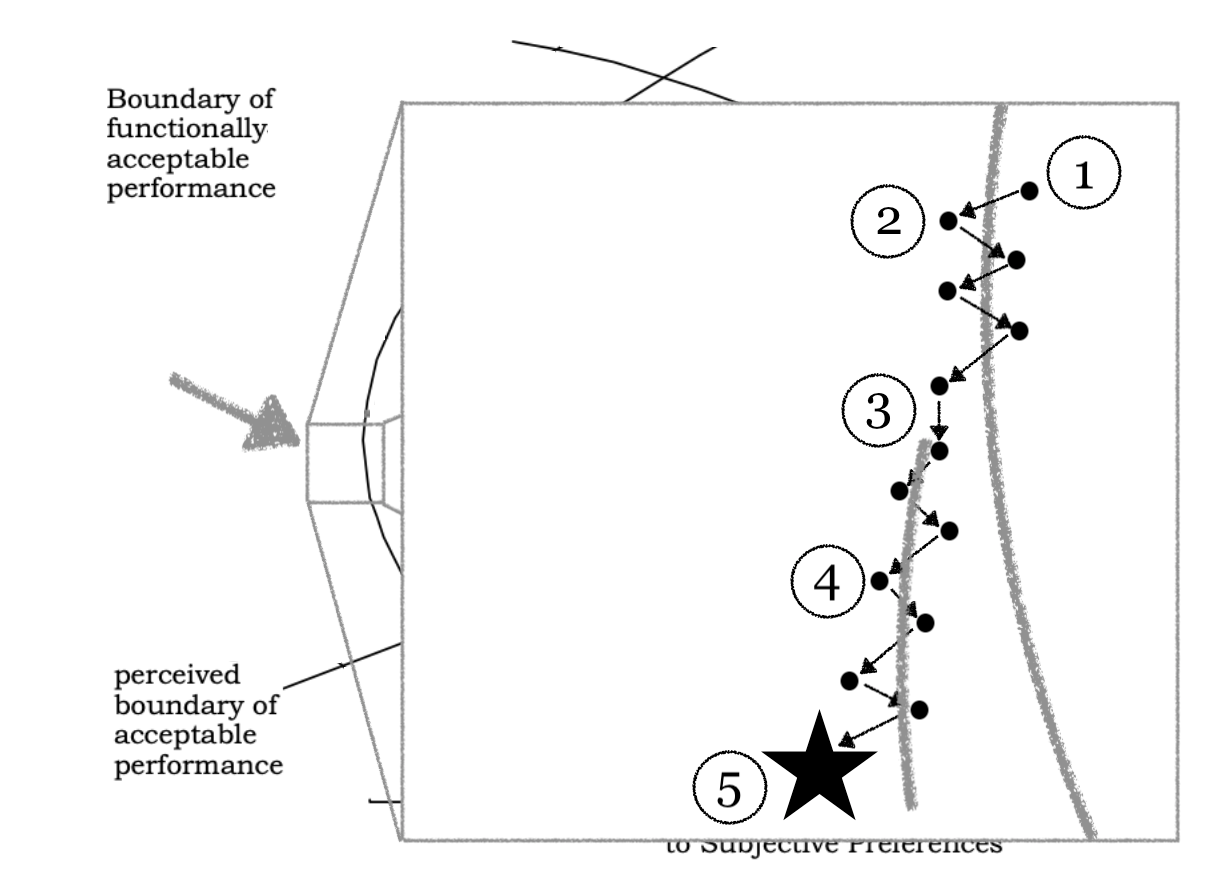
While Rasmussen’s model is valuable, here is a depiction of what it looks like for complex systems in practice.
Note the loss of information on the left hand side. We still know that the Boundary of functionally acceptable performance is somewhere on the left, but we don’t know exactly where it is. All we have is our perceived boundary of acceptable performance. This disparity causes an interesting dynamic. Let’s zoom in on the perceived boundary of acceptable performance and consider what happens to a system near such a boundary.
The system, due to normal operation, crosses our perceived failure boundary.
We notice that things are in a configuration where we expect them to fail, they’re not failing yet, so we quickly apply remediation and shift the system back to within acceptable performance. This cross into failure, no actual failure, and quick remediation continue until we reach 3.
We now discovered that our perceived failure boundary is not the actual failure boundary. We acclimatize. We move our perceived failure boundary to match.
The pattern of crossing into failure, system not failing, and remediation back into acceptable (now shifted) performance continues. We drift further.
We ultimately locate the actual failure boundary, the system fails, and we inadvertently entered into Chaos.
The fact that the actual failure boundary is often unknown until our complex system fails, combined with the invisible unknown boundary continually shifting (in the Complex domain constraints change due to actions and the environment), demonstrates a pattern of how our systems will continuously flirt with the failure boundary. Do not forget that we have forces pressuring the system from right to left, the pressure of efficiency, and the gradient toward ease of work. This continuous pressure and not really knowing where the failure boundary lies combine to continuously shift the system toward failure.
What Do You Think?
How do you think about system failures? Let me know in the comments.
Next Up
Next, I will discuss how the words we use shape our thinking: Metaphors We Live By.